Available exclusively to .Trends users, the Audience report analyzes the audience in your industry, providing you with actionable insights into who you (and your competitors!) are marketing to, and how they behave online.
How Can the Audience Report Help Me?
The Audience report is designed to help you understand the audience of the analyzed market, whether they interact primarily with you, or with the competition. It can tell you:
- The sex and age distribution of your target audience
- Their socioeconomic status - education level, employment status, average income, and household size
- The most popular social media platforms used by the analyzed market audience
- The key interests of your target audience based on the categories of visited domains
With this data, you can tailor your content, advertising, and social media strategies, and build more effective relationships with your audience.
Using the Audience report
As you use the Audience report, keep in mind that it breaks down audience demographics based on the specific industry or custom market you’re analyzing. As a result, if you view a different custom market report, or change the country or period being examined, the demographics insights displayed here will change accordingly.
Market Audience Summary
At the top of the report, you’ll discover the Market Audience Summary. This section provides an overview of the market audience’s most relevant characteristics, including Demographics, Socioeconomics, and Behavior.
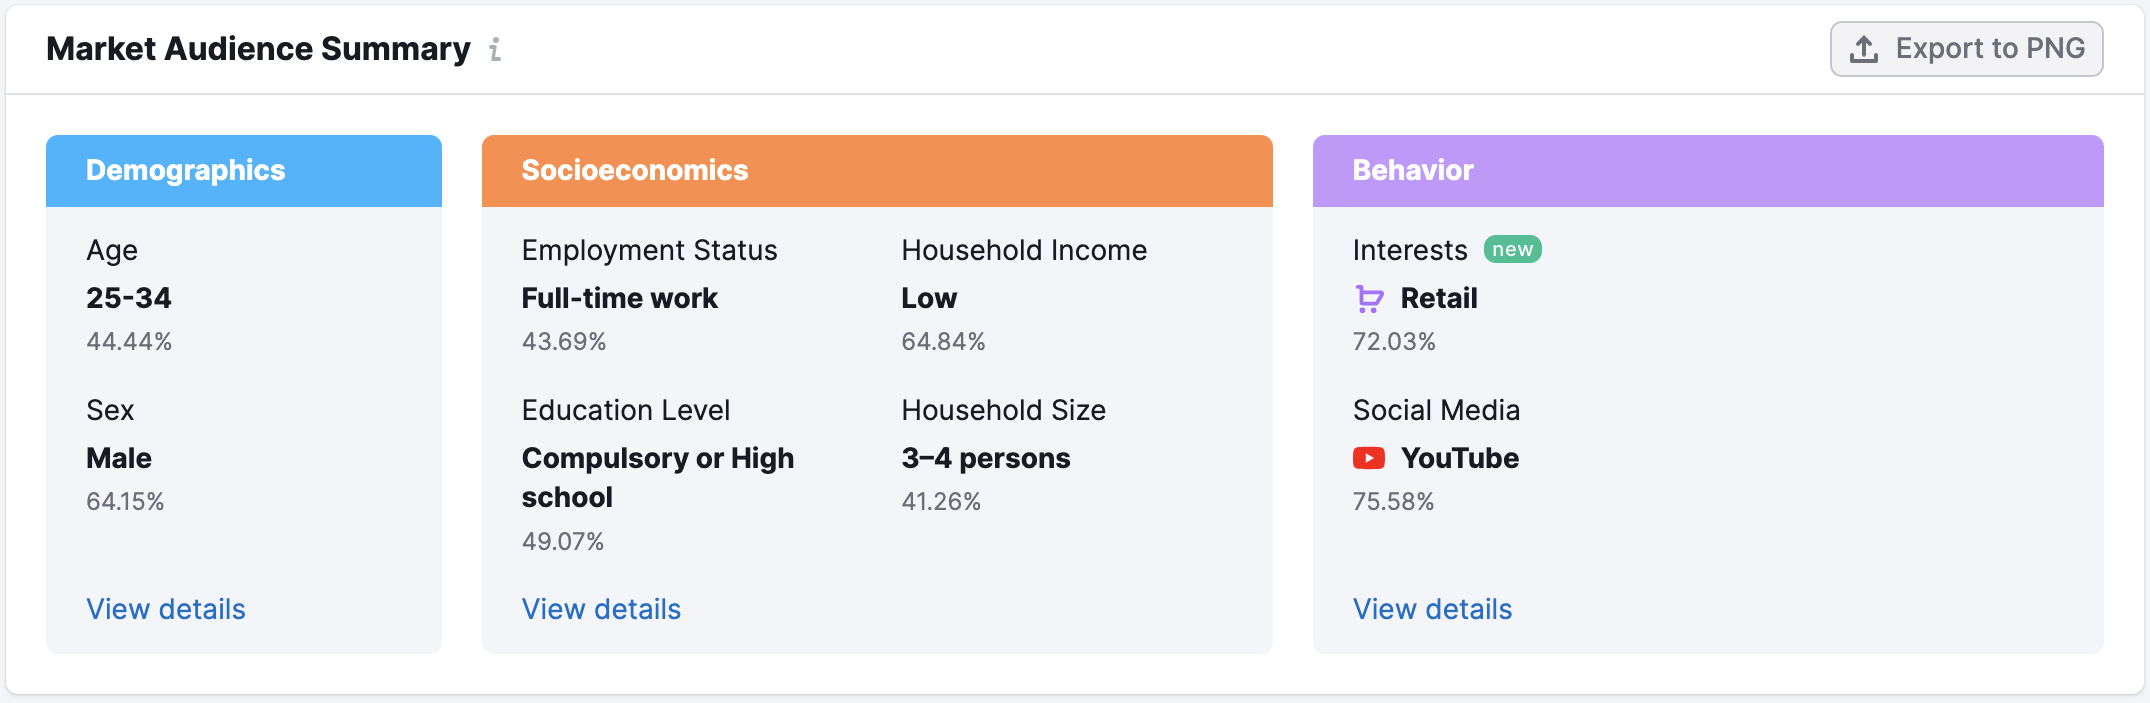
With a quick glance, this section reveals the largest segments of your audience in terms of age, sex, employment status, education level, household income, household size, the most visited domain categories, and the most popular social media platform.
For a more detailed breakdown of each audience segment, continue to the next sections of the report.
Demographics
The demographics section shows a breakdown of the market audience by Age and Sex.
The graph to the left shows the breakdown of your audience according to age. The horizontal axis indicates the age segments of your audience, the vertical axis is the percentage of the total audience that falls within the segment.
The Sex breakdown is on the right side. Each bar is divided into two colors to represent the female and male portion of the audience.
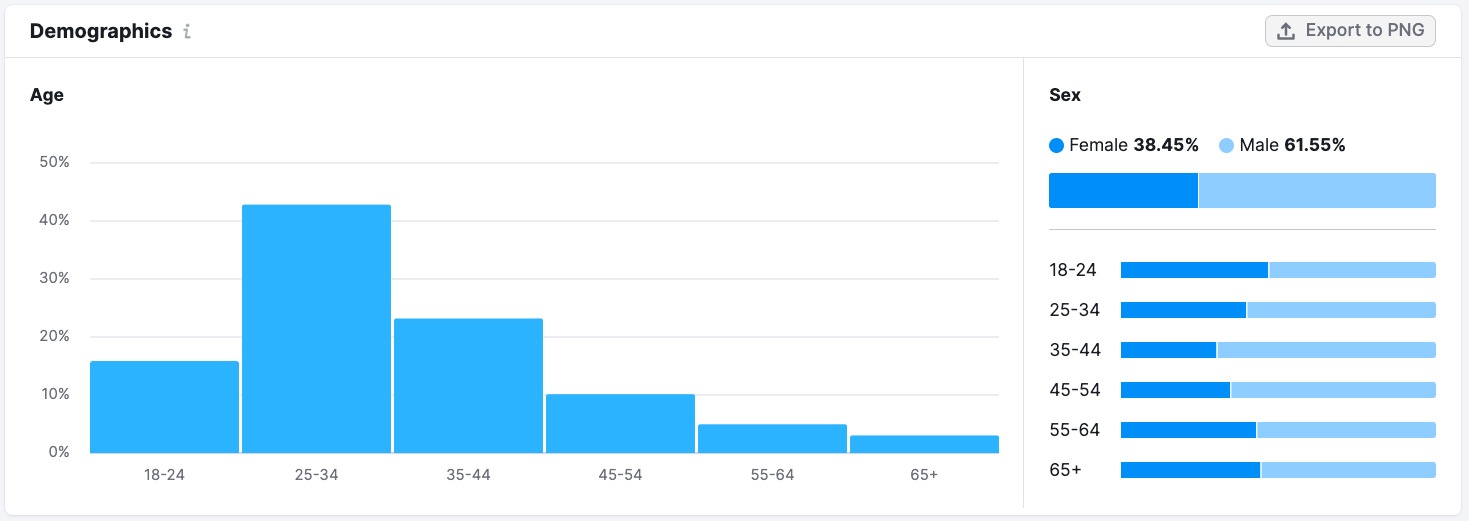
If you need to view the specific breakdown of any segment, place your cursor over the one you’re interested in and a window will appear.
Socioeconomics
The Socioeconomics section shows the breakdown of your audience according to several criteria:
- Employment Status– shows the breakdown of the audience according to various employment statuses
- Education Level– shows the breakdown of the audience according to the highest completed level of education
- Household Income –shows the breakdown of income level by household across the market
- Household Size– shows the breakdown of household sizes across the market, from single-person households to households with 5+ persons
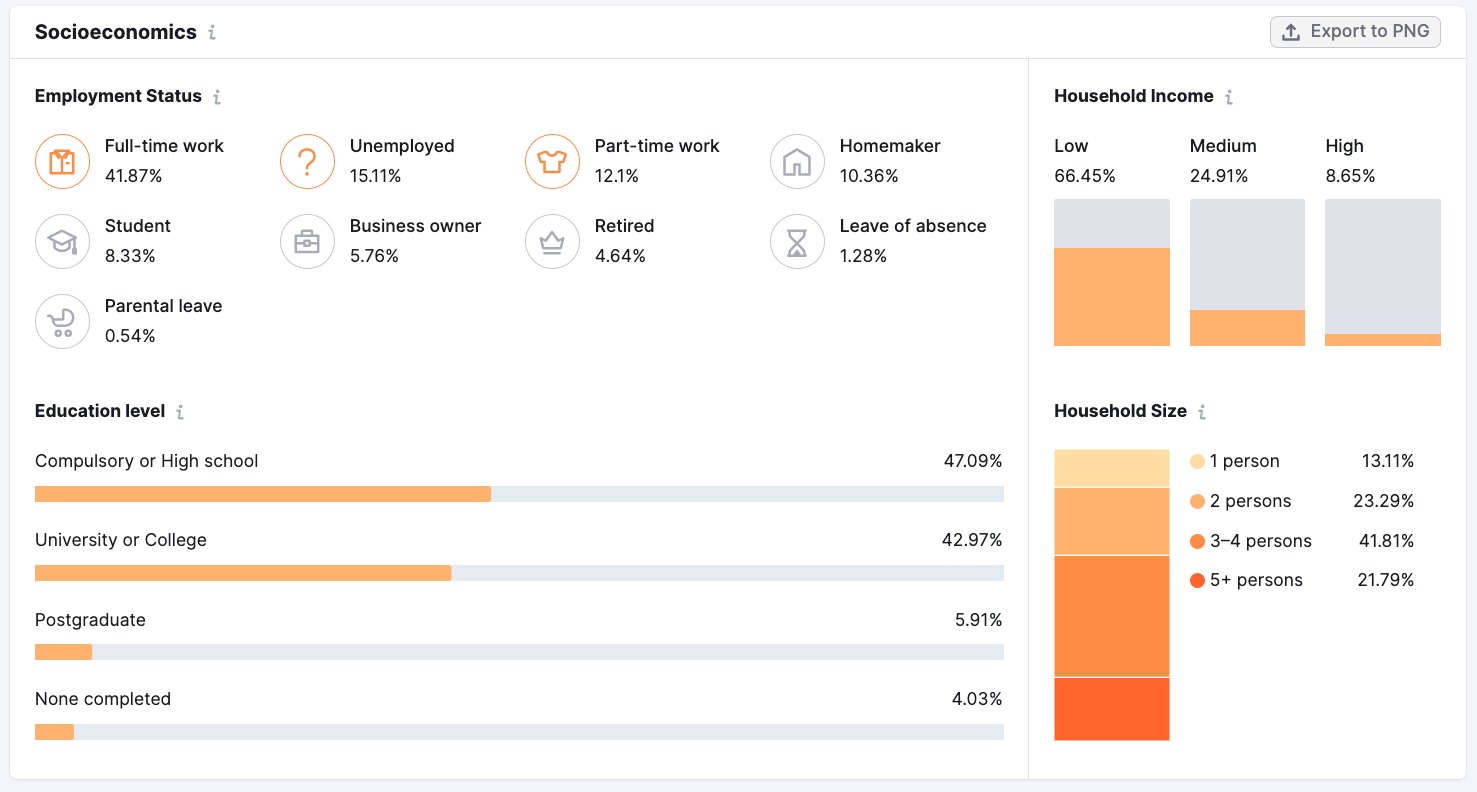
In the Employment Status section, the top three statuses for your market are shown in the first three positions. The remaining sections show the audience breakdown with bar graphs.
Note that the Household income percentages are defined by the country database you selected. Low, middle, and high-income levels may differ depending on the industry you’re looking into.
Interests
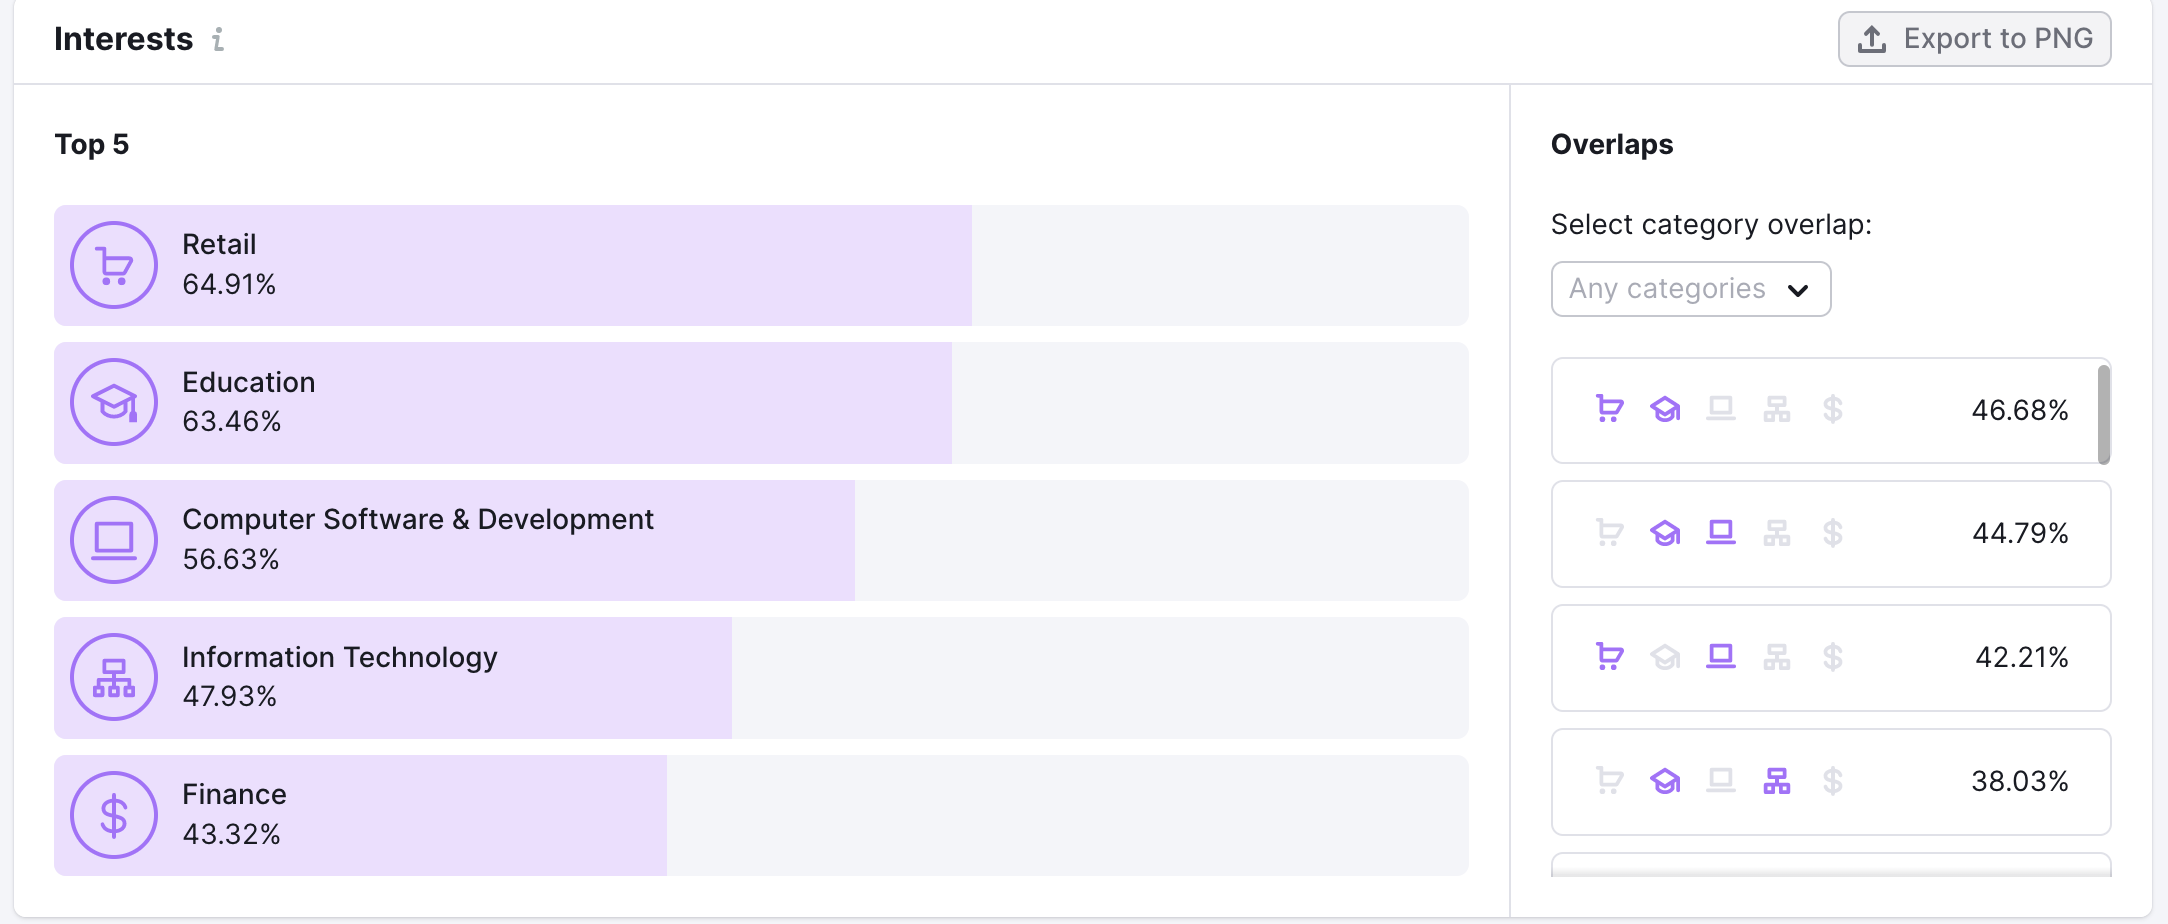
The Interests widget shows the top five audience interests based on the most visited domains and allows discovering overlaps across categories. Insights into audience interests can help you find new audiences to target, uncover potential partners in adjacent industries, and locate new ad placement opportunities.
The Overlaps show the percentage of the audience of the analyzed market or a domain that visited the websites from these categories.
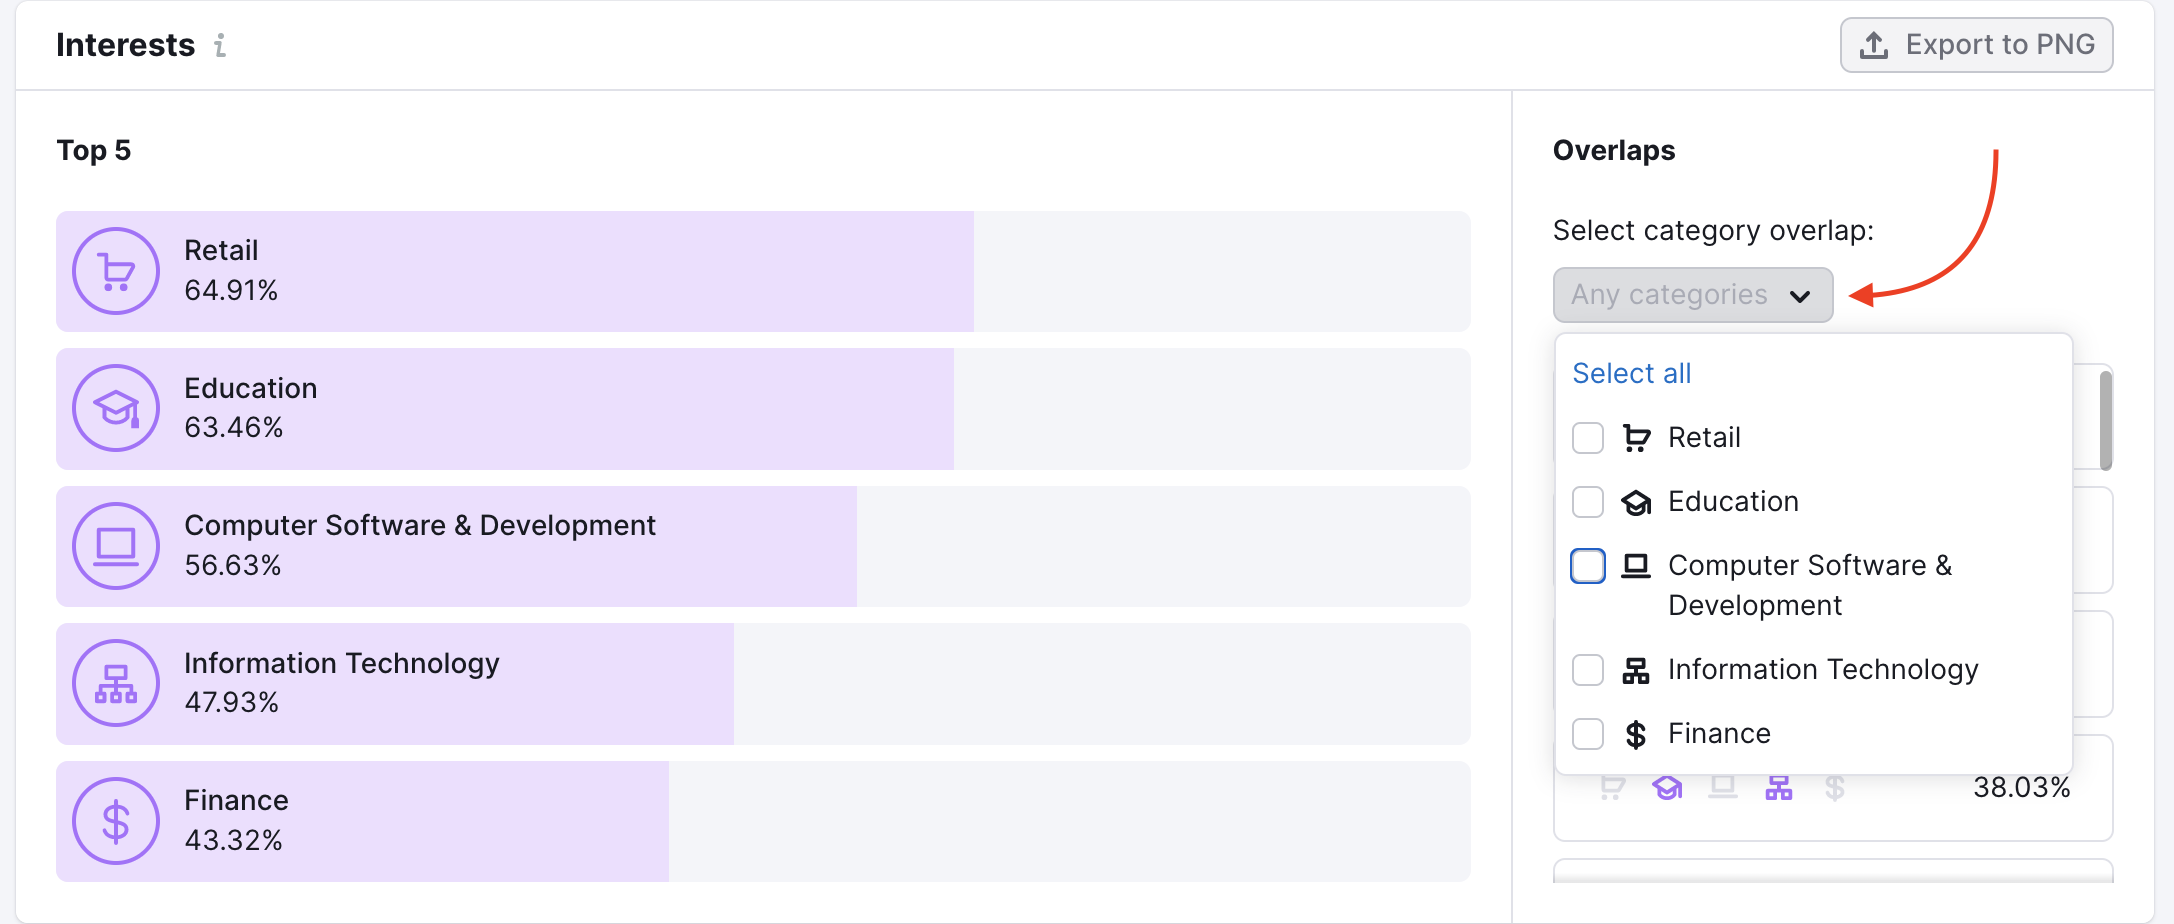
If you need to see the overlap of some specific categories, you can filter them.
Social Media
The Social Media Preferences widget contains a bar graph segmenting the most popular social media platforms used by the chosen market’s audience.
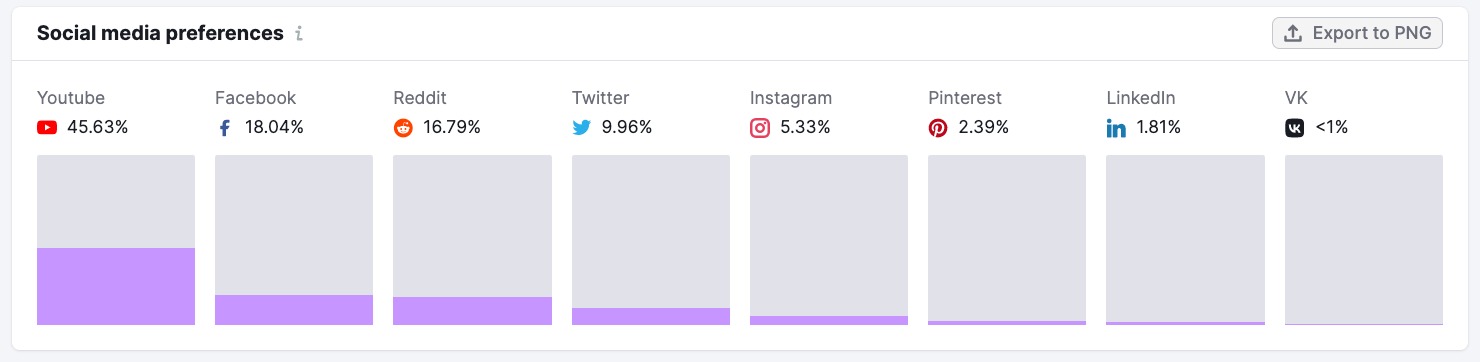
The percentage reflects the portion of the total audience that visited the given platform. Again, this chart will change depending on the country database you choose to explore.
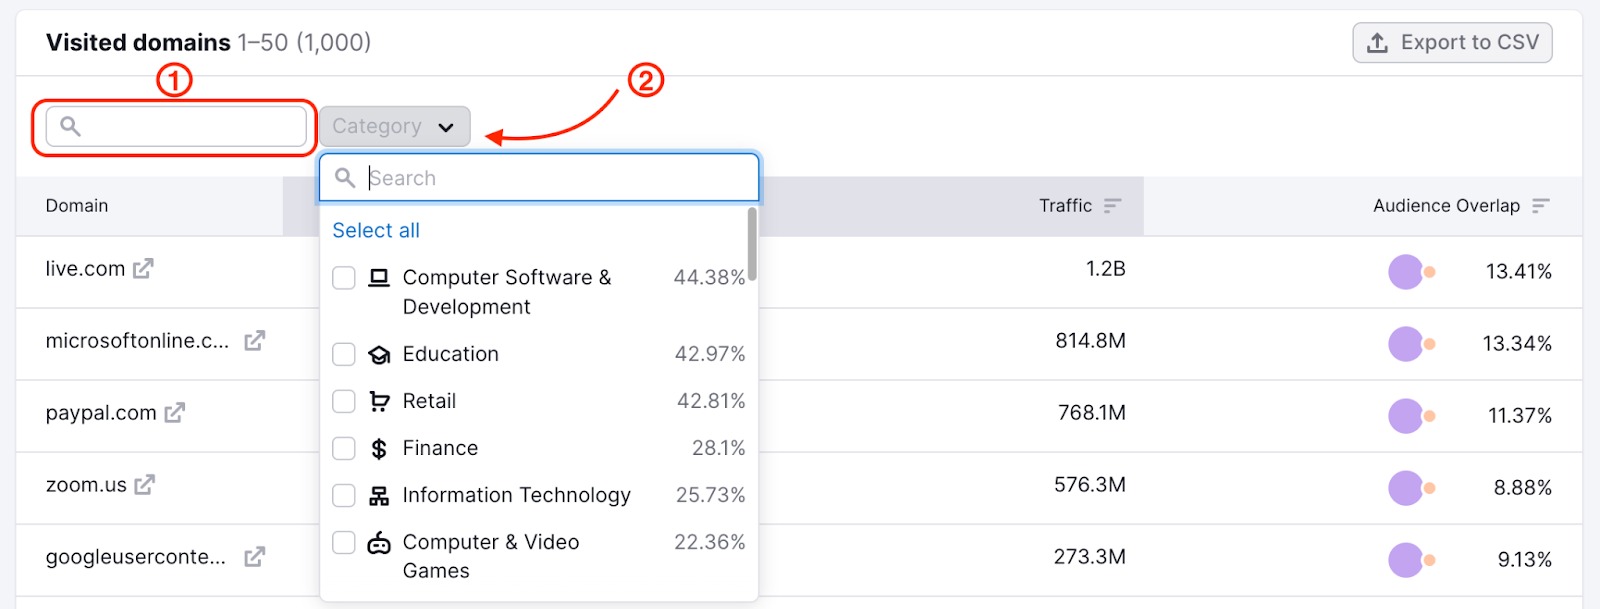
Visited Domains
The Visited Domains table shows a list of domains the market audience visited and the overlap of the domain’s audience with the market’s one.
Along with traffic and audience overlap data, you’ll discover the new Match Score metric – a combination of a domain’s traffic and its audience overlap with a market. Combining it with the category filter may help to find interesting potential partnerships or advertising opportunities.
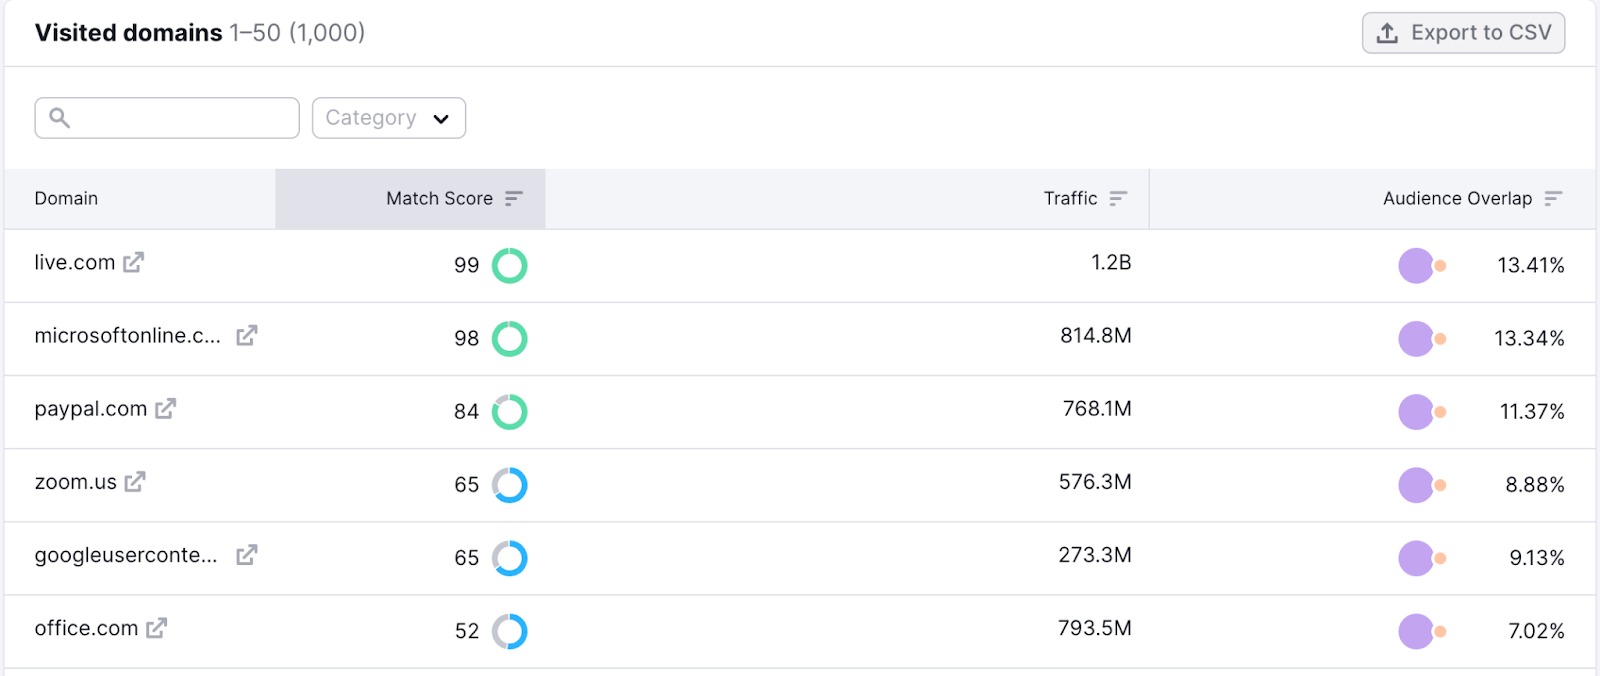
Filter the results by domain (1) or category (2) to find the best opportunities for your specific goals.