If you’re planning to enter a new niche or market, you’ll want to know how to get a quick overview of the top competitors as well as the habits and demographics of the target audience.
You’ll want to learn about the actual people in your market — what are their buying habits, preferences, and Internet browsing trends?
Luckily, if you have access to the Semrush .Trends solution, this can be an easy process with our Traffic Analytics, Market Explorer, and One2Target tools.
Tip: Follow this workflow for finding online competitors with Semrush. Those methods will help you discover more websites that are similar to the one you already know is in the niche.

Scan the market’s trends with Market Explorer
When you enter a domain in a market you want to study (this could be either your site or a competitor’s site) into this tool, you can start getting immediate insights into the market’s behavior.
The market in this tool is defined by websites with similarities in multiple parameters such as audience interests, website categories, number of backlinks, common organic keywords and positions on the SERPs. So, we build the market in this tool based on competition in online visibility.
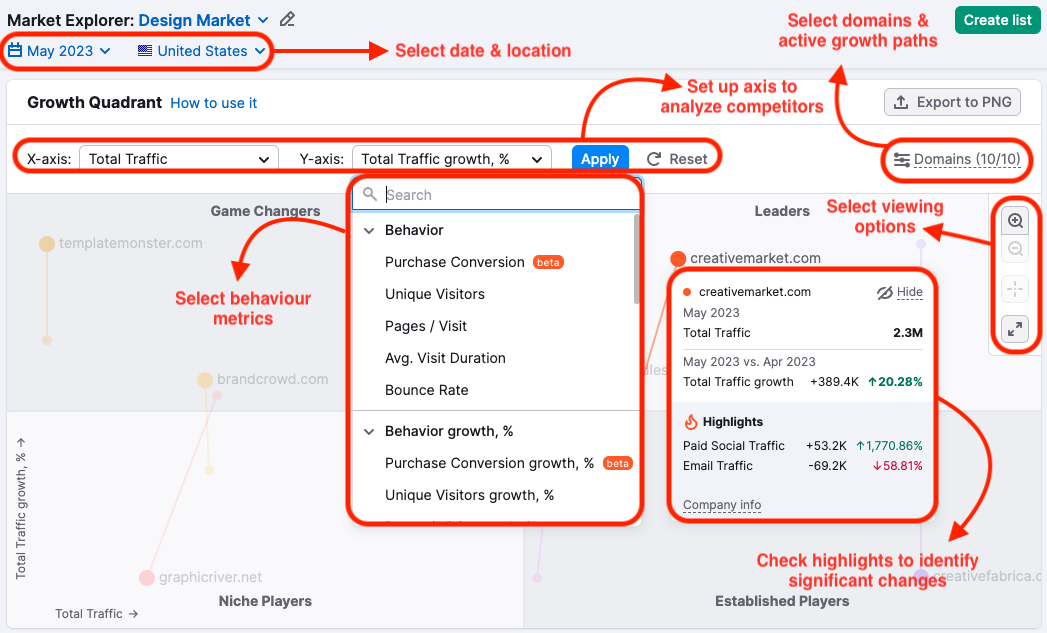
Growth Quadrant
Very quickly at the top of the report, you can see the Growth Quadrant. This shows you the competitive landscape made up of the 100 top industry players. This gives you a great place to visualize how your niche is shaping up.
You have the option to customize your view in a few different ways:
- By changing the time period and location
- By turning “Growth Paths” on to view market players’ growth across the selected period of time
- By filtering traffic sources to show competitor positions based on the selected channel
- By revealing or hiding certain players on the matrix
- By viewing in full-screen mode, or zooming in, or zooming out
To analyze a specific niche, use the check boxes in the sidebar to select the players that fit into that specific niche. For example, let’s say you had 100 competitors from the beauty industry displayed in your matrix. If you wanted to explore the hair products niche, you’d select only the players that fit specifically into that niche.
Traffic Trends
To the right on the share of visits can see each domain’s total traffic compared to the overall market’s traffic on a line graph as well as the traffic trend. The example below shows the trend of burton.com compared to the rest of the market (winter sports).
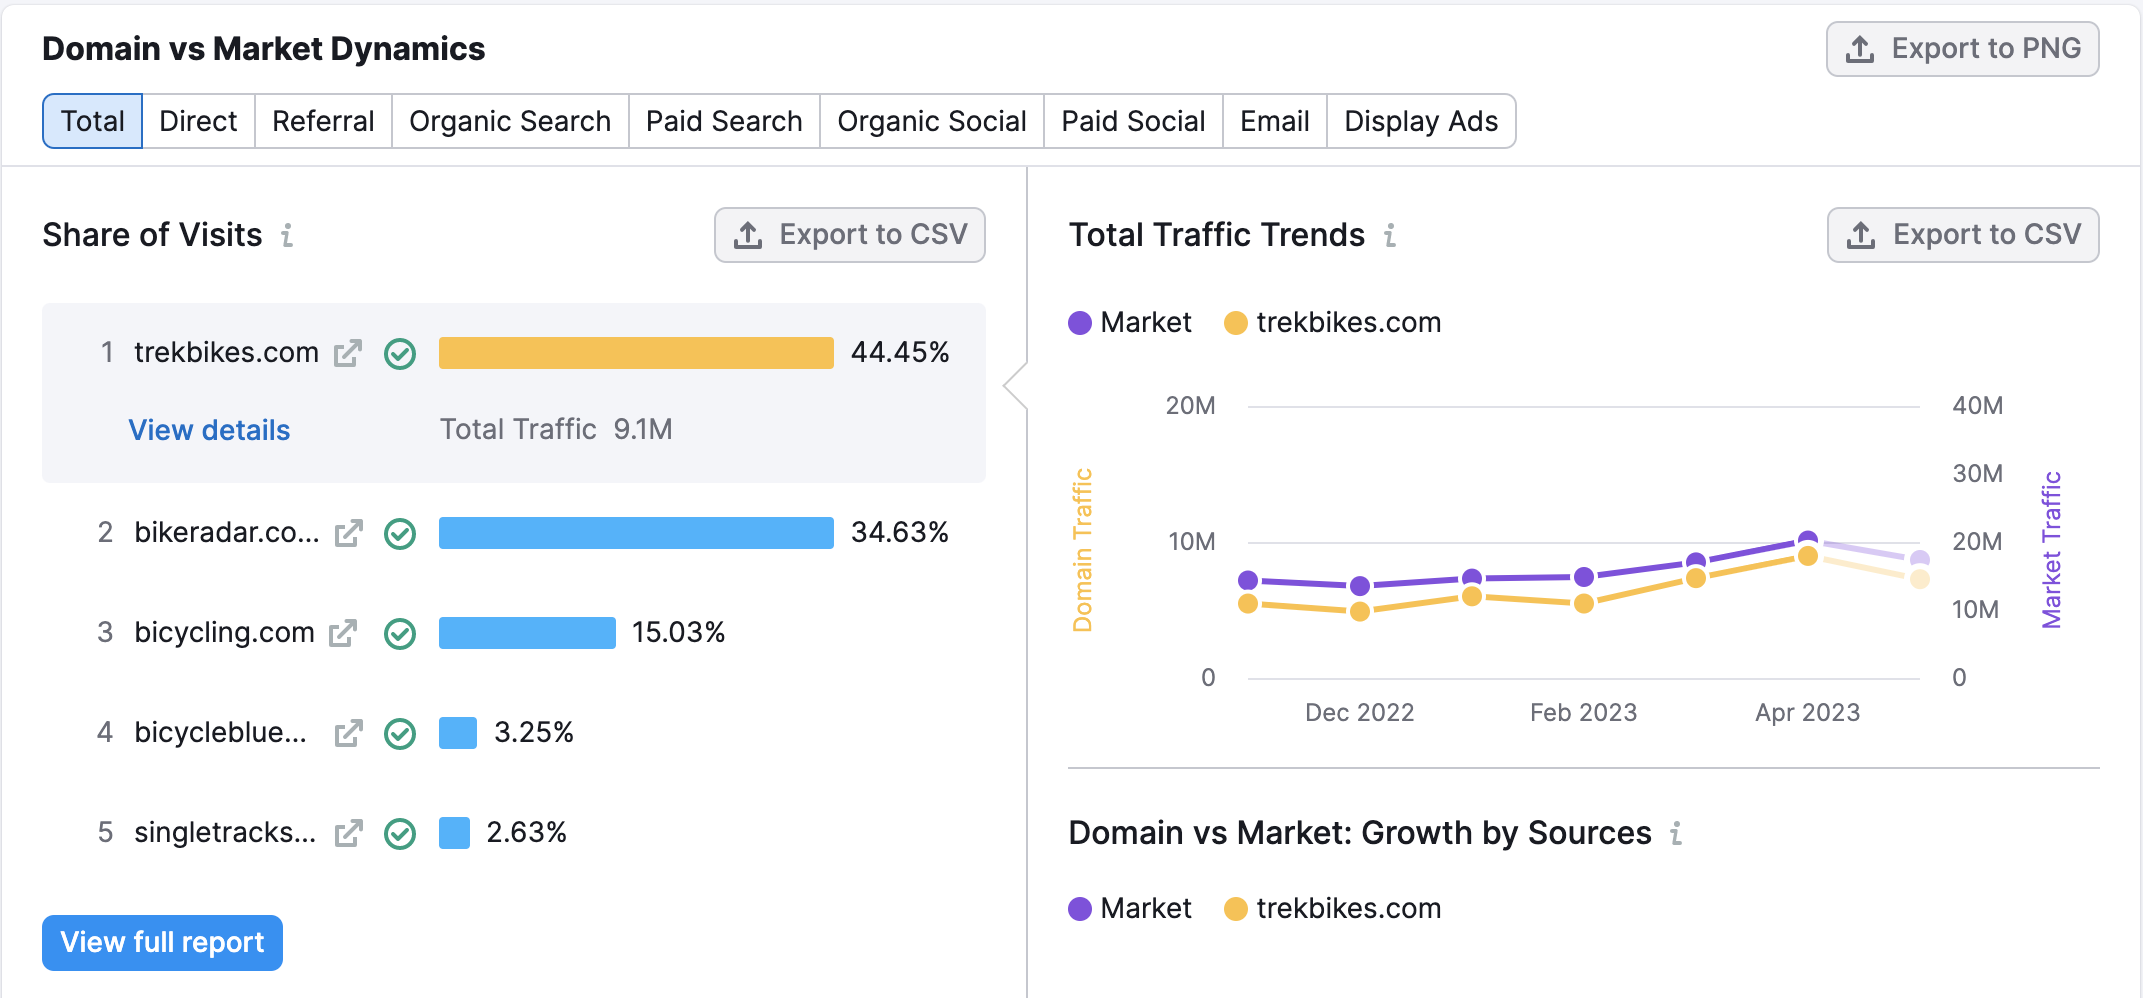
Notice the spike in traffic for both the overall market and the selected website in the month of January. This signifies a seasonal trend in the niche — you can expect more traffic in the winter months.
Scroll down to see a visualization of the market’s traffic by source — direct, referral, organic search, paid search, organic social, paid social, email, and display advertising. This tells you what paths people normally take to eventually get to those websites.
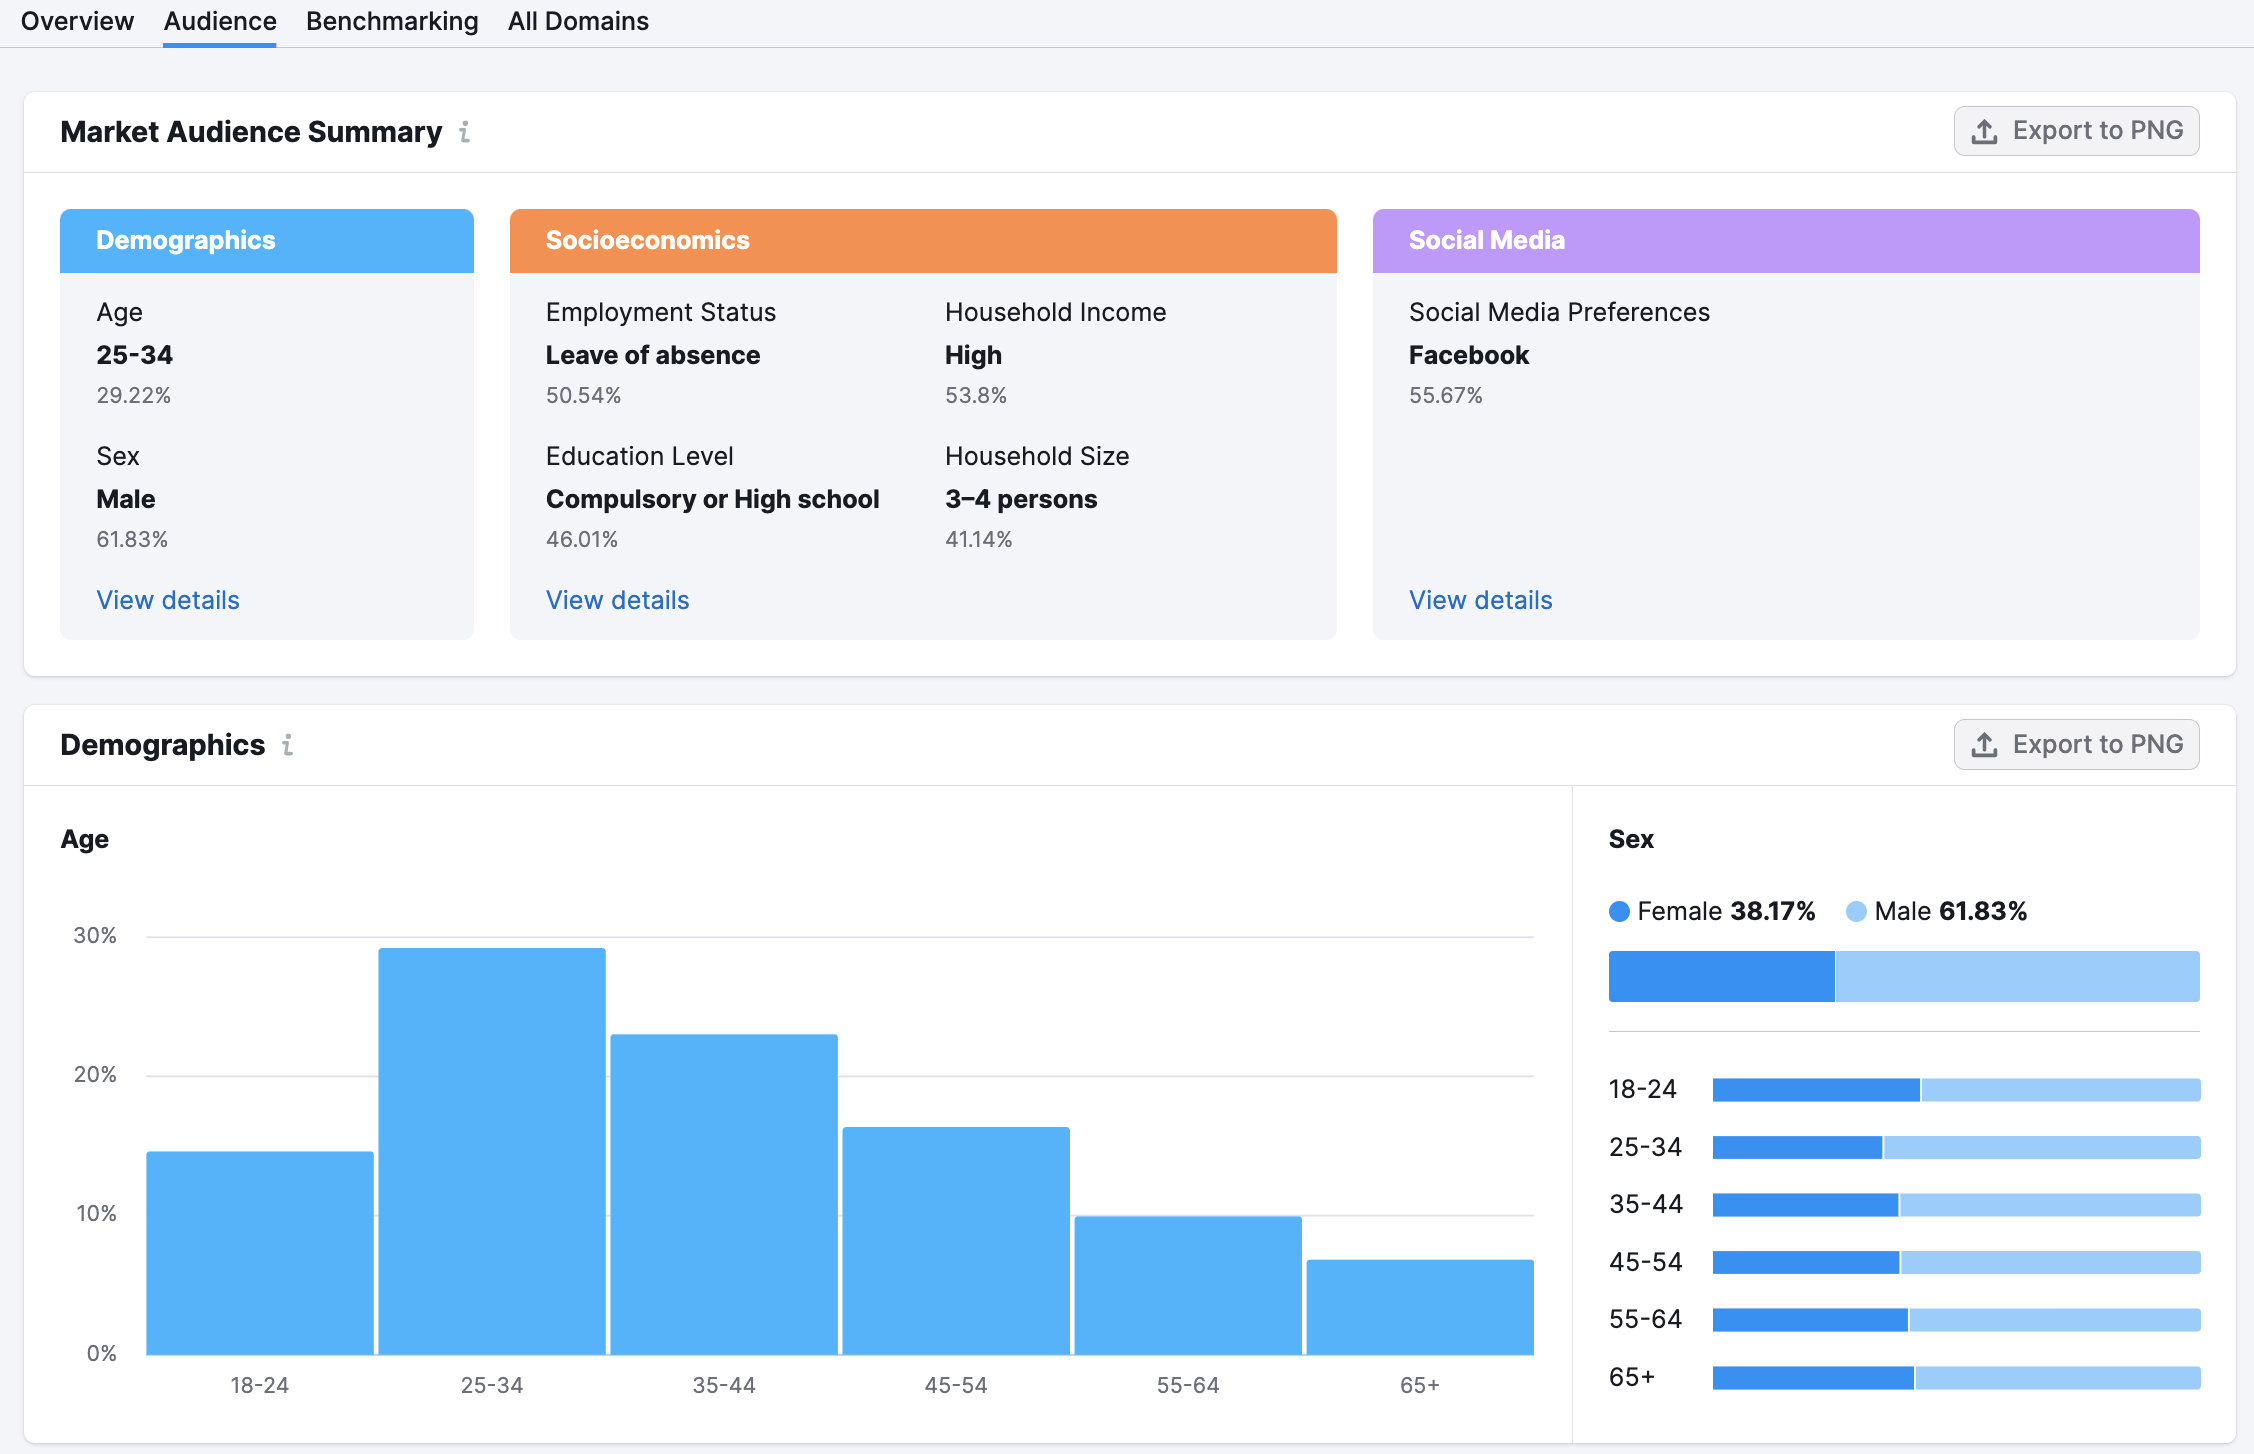
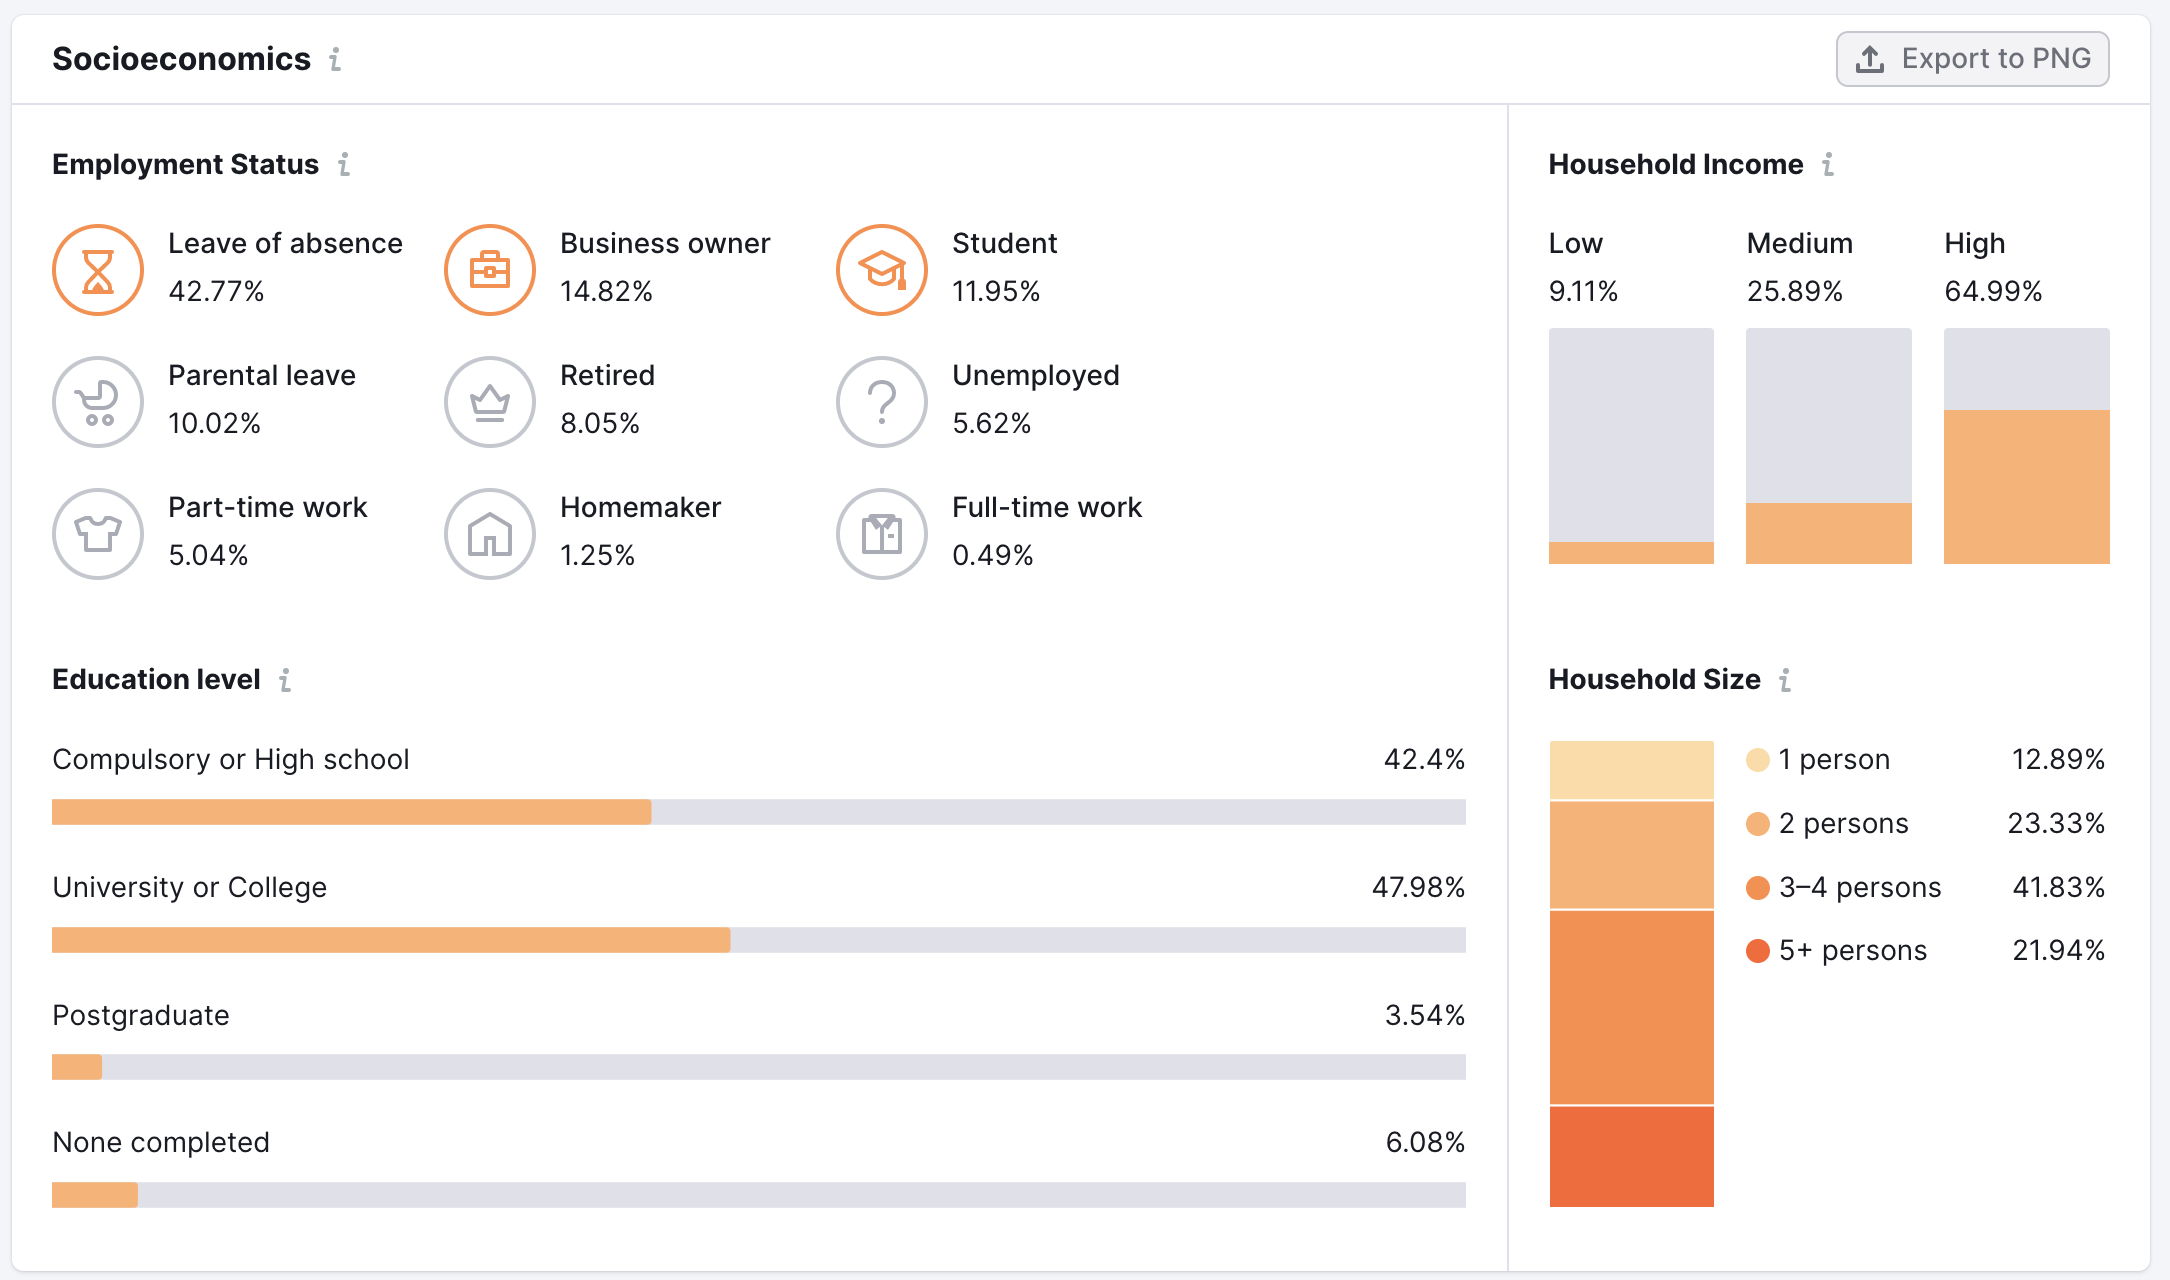
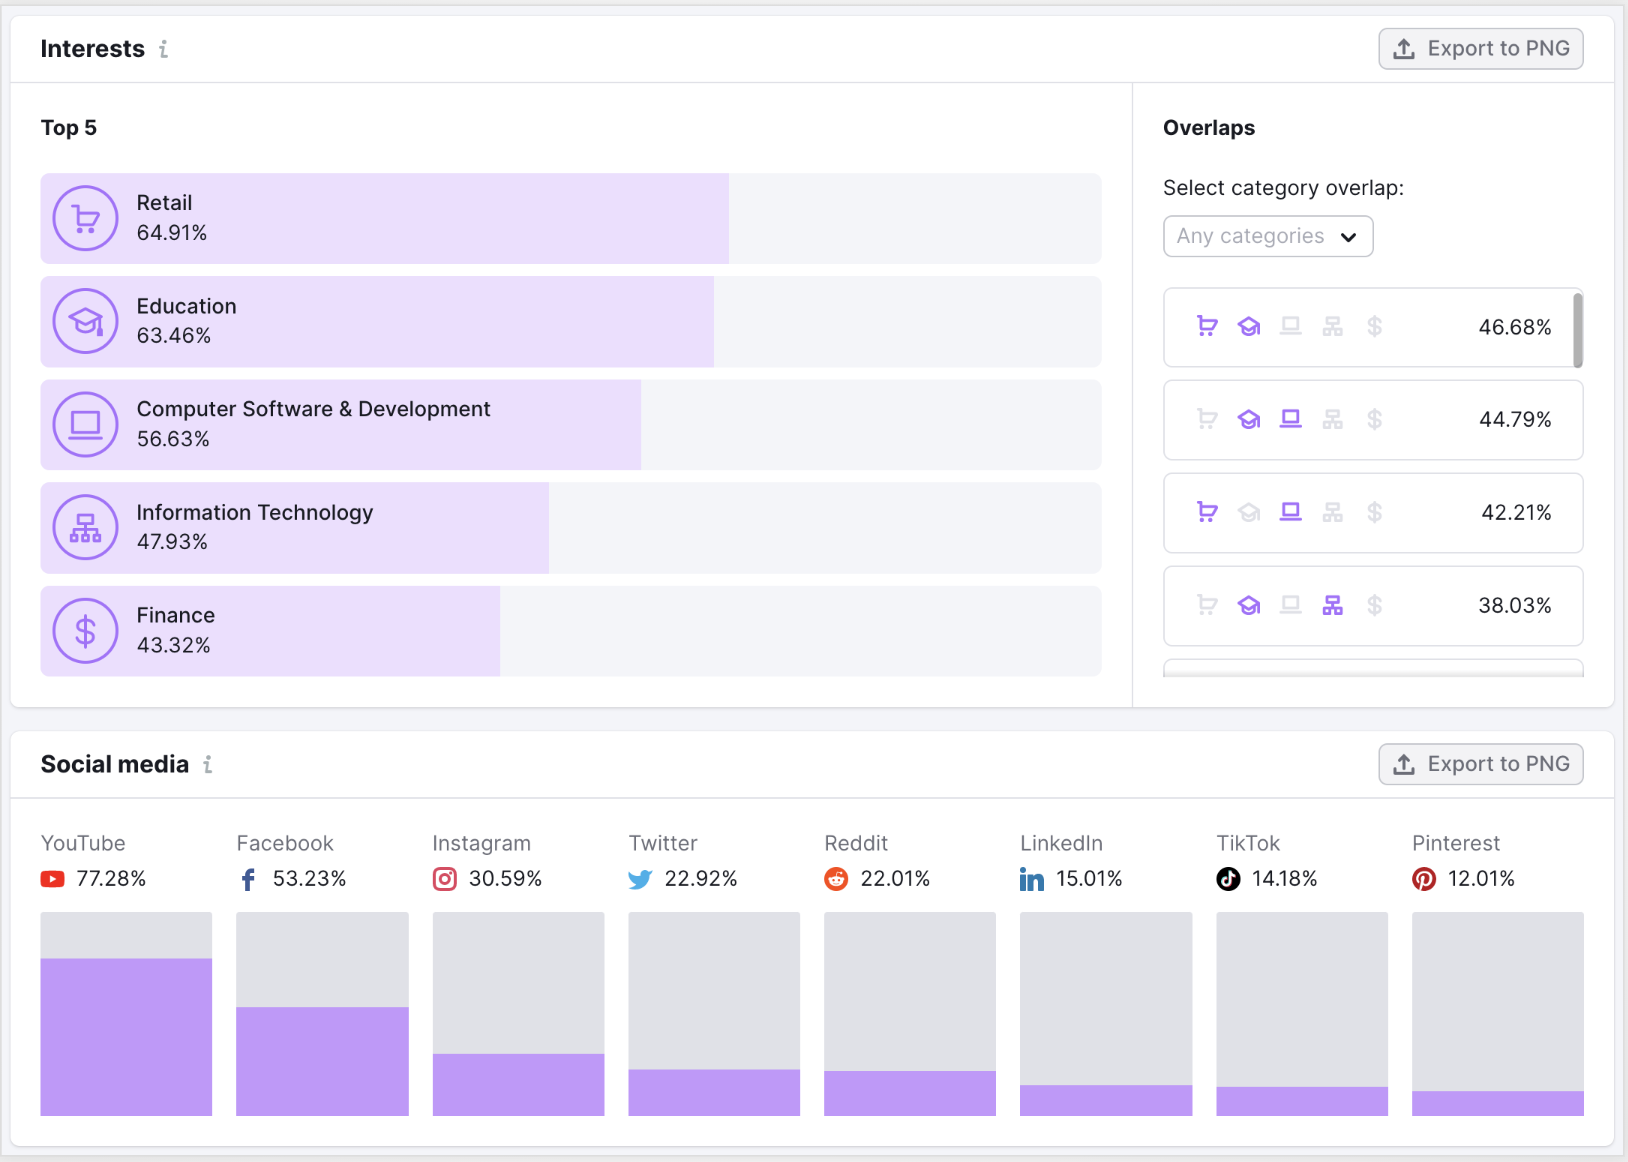
In the Audience tab, you’ll find data that will help paint the picture of who the target audience is in this niche.
Export from All Domains report
In the All Domains tab of this tool, you can review all of the sites in the market in a sortable table. From here you can see the top 500 rows of sites based on each metric, and even export this data to save your research.
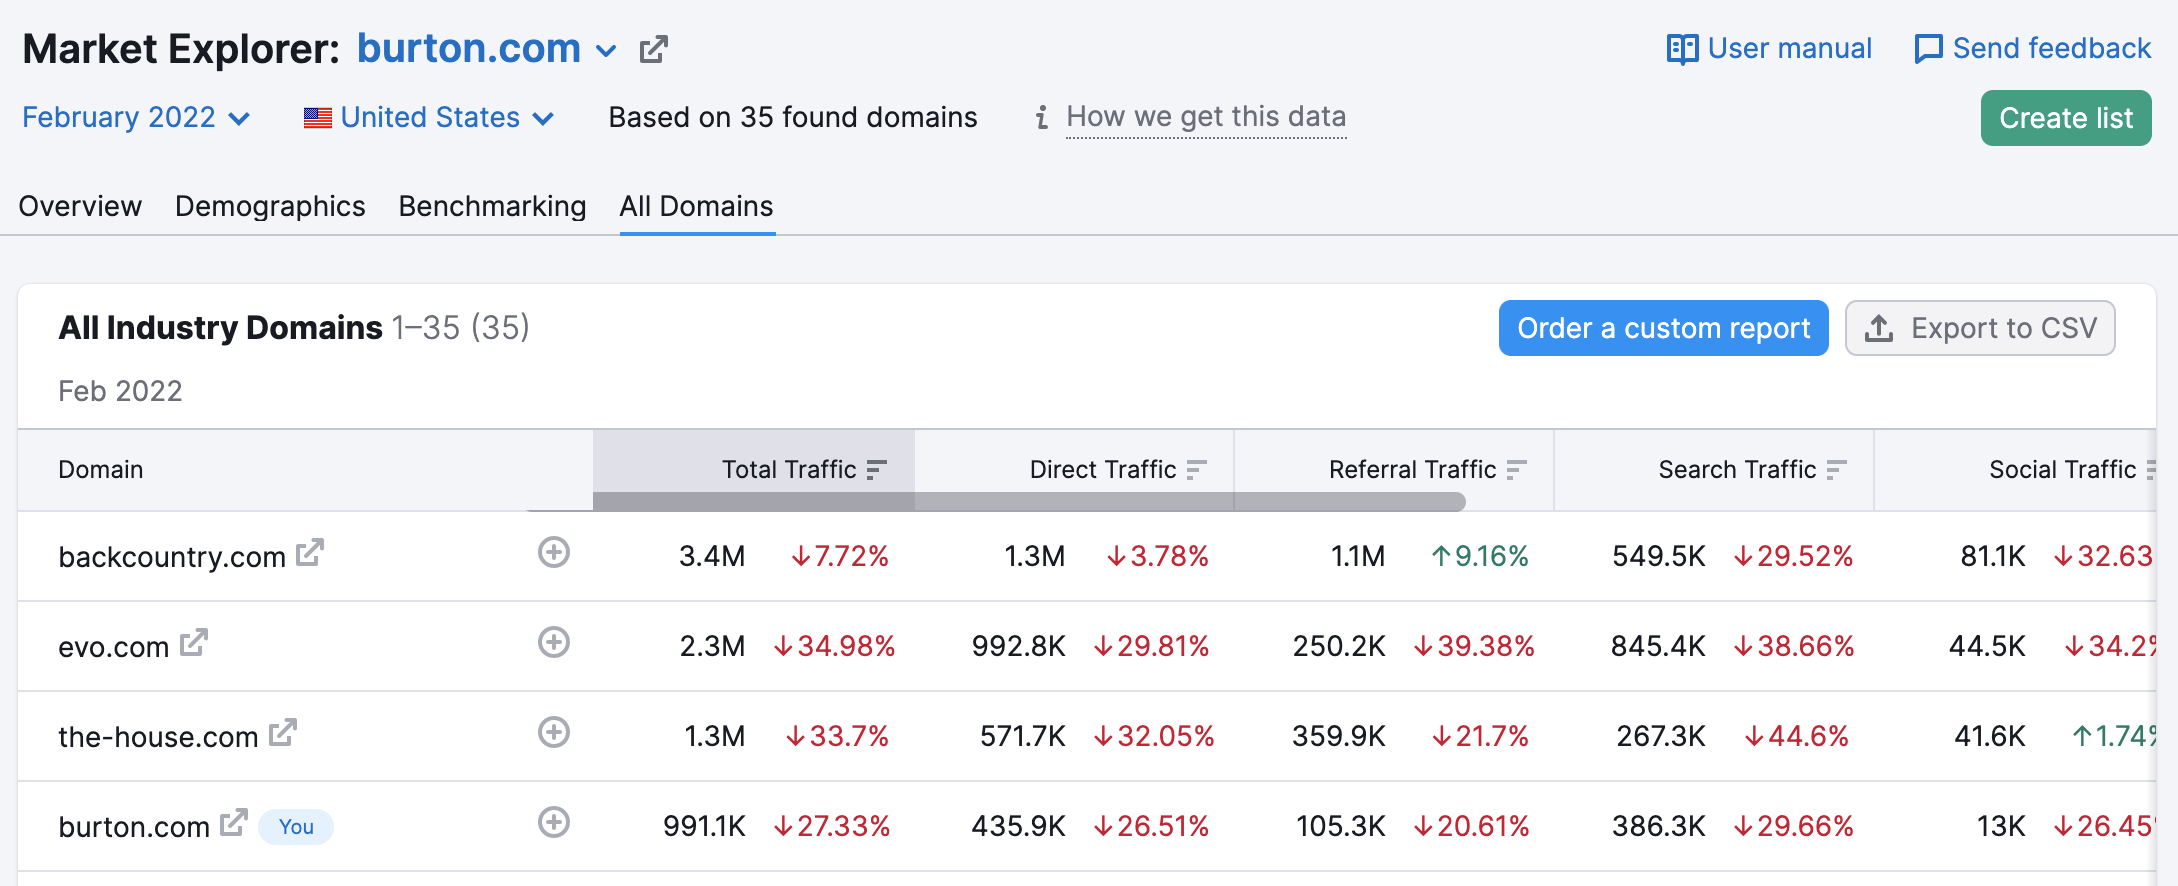
If you want more than that, you can order a custom report from us.
Analyze up to 5 competitors in the niche with Traffic Analytics
Once you have identified 5 domains to study, go to the Traffic Analytics tool and enter these domains into the form fields at the top to study them more in-depth.
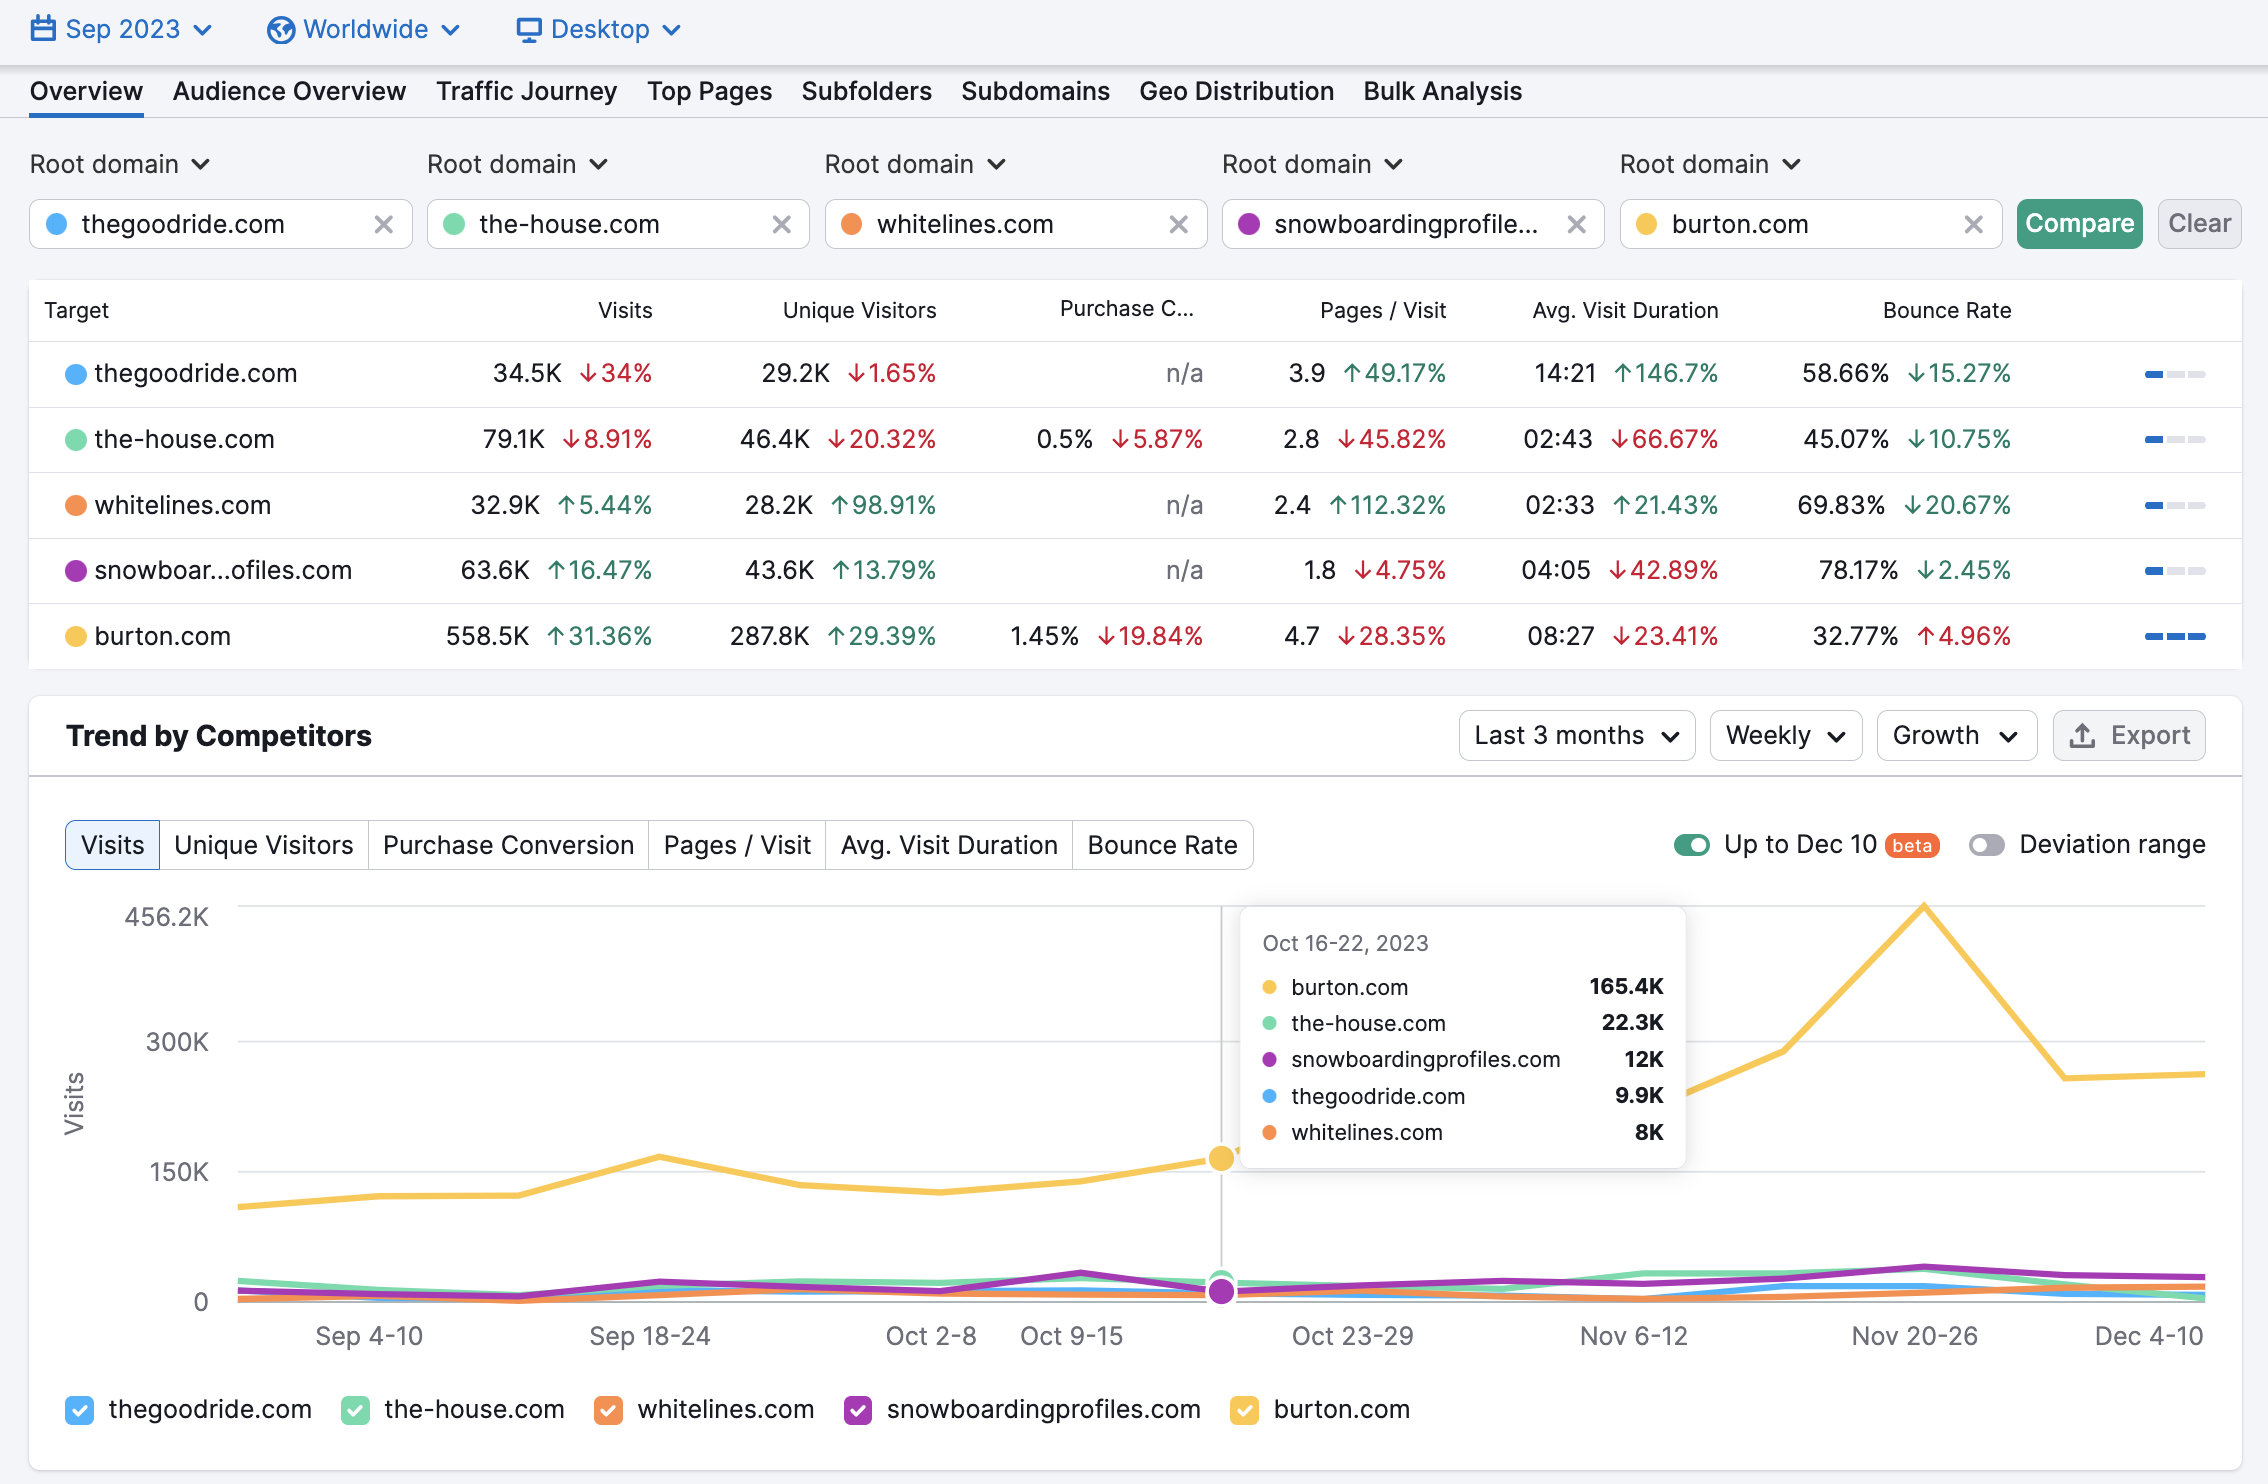
User Engagement
The top of this report will show you user engagement metrics like time on page, pages per session, and bounce rate estimates for each domain. This tells you how engaged people are when interacting with this niche online.
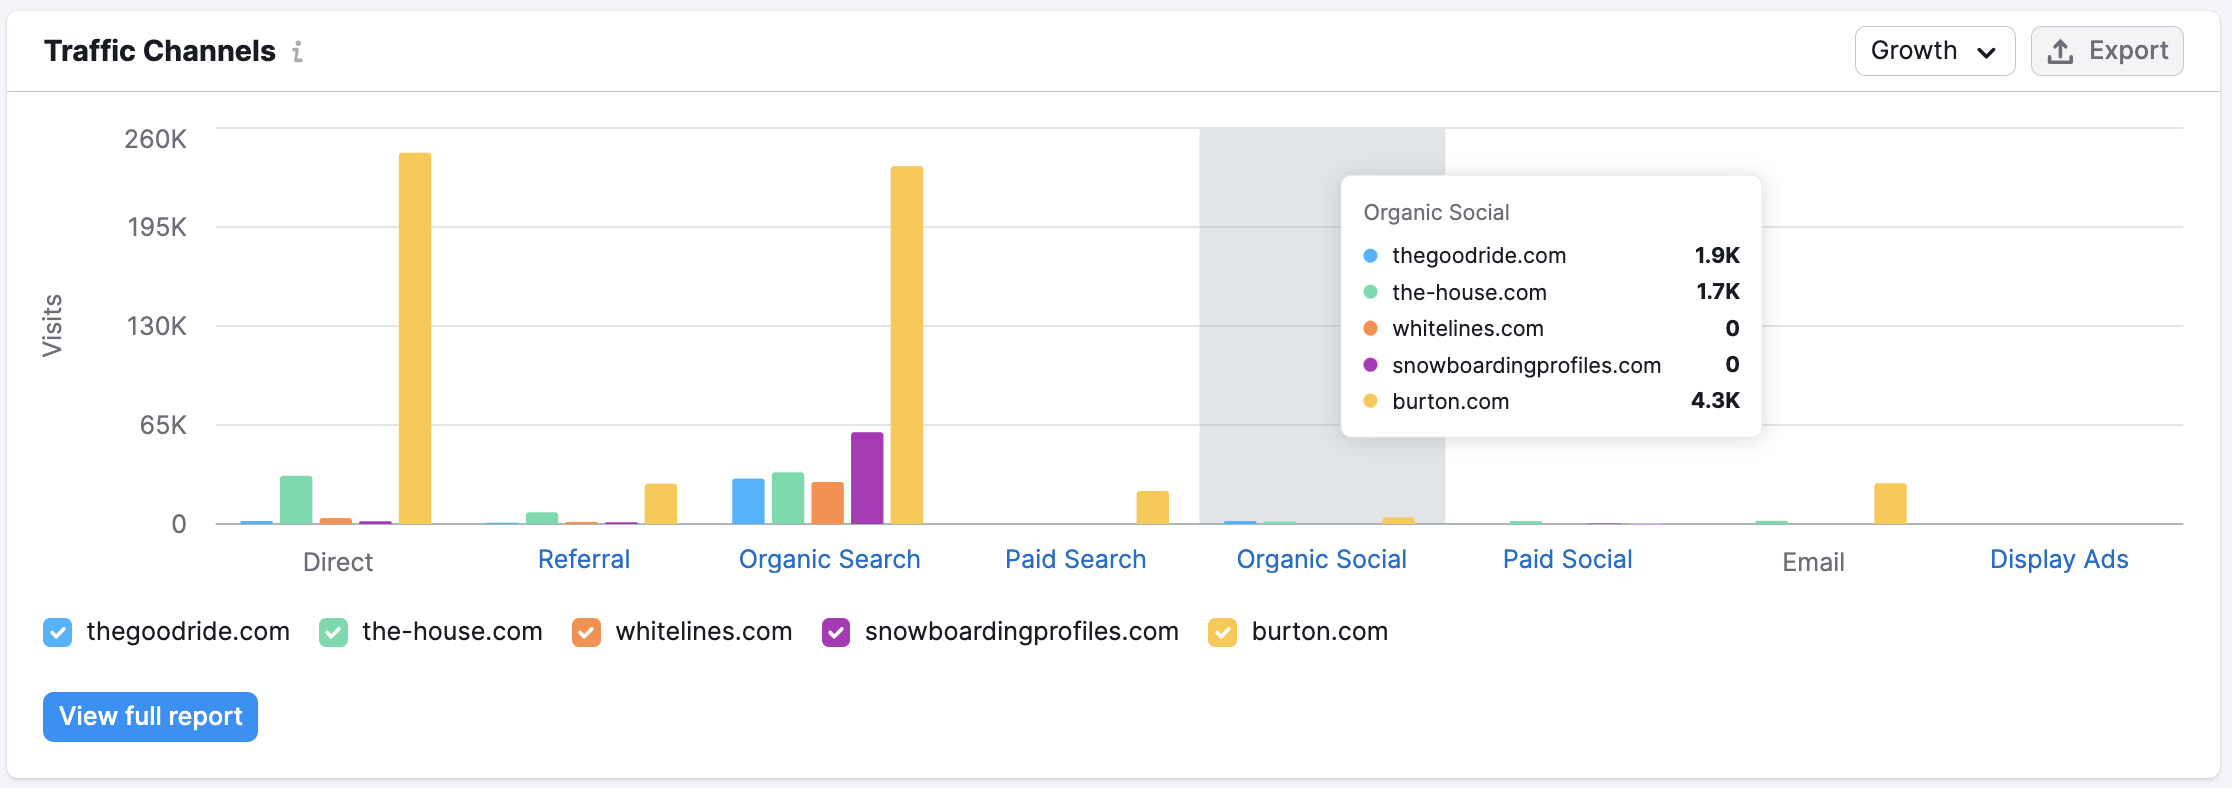
Top Traffic Channels
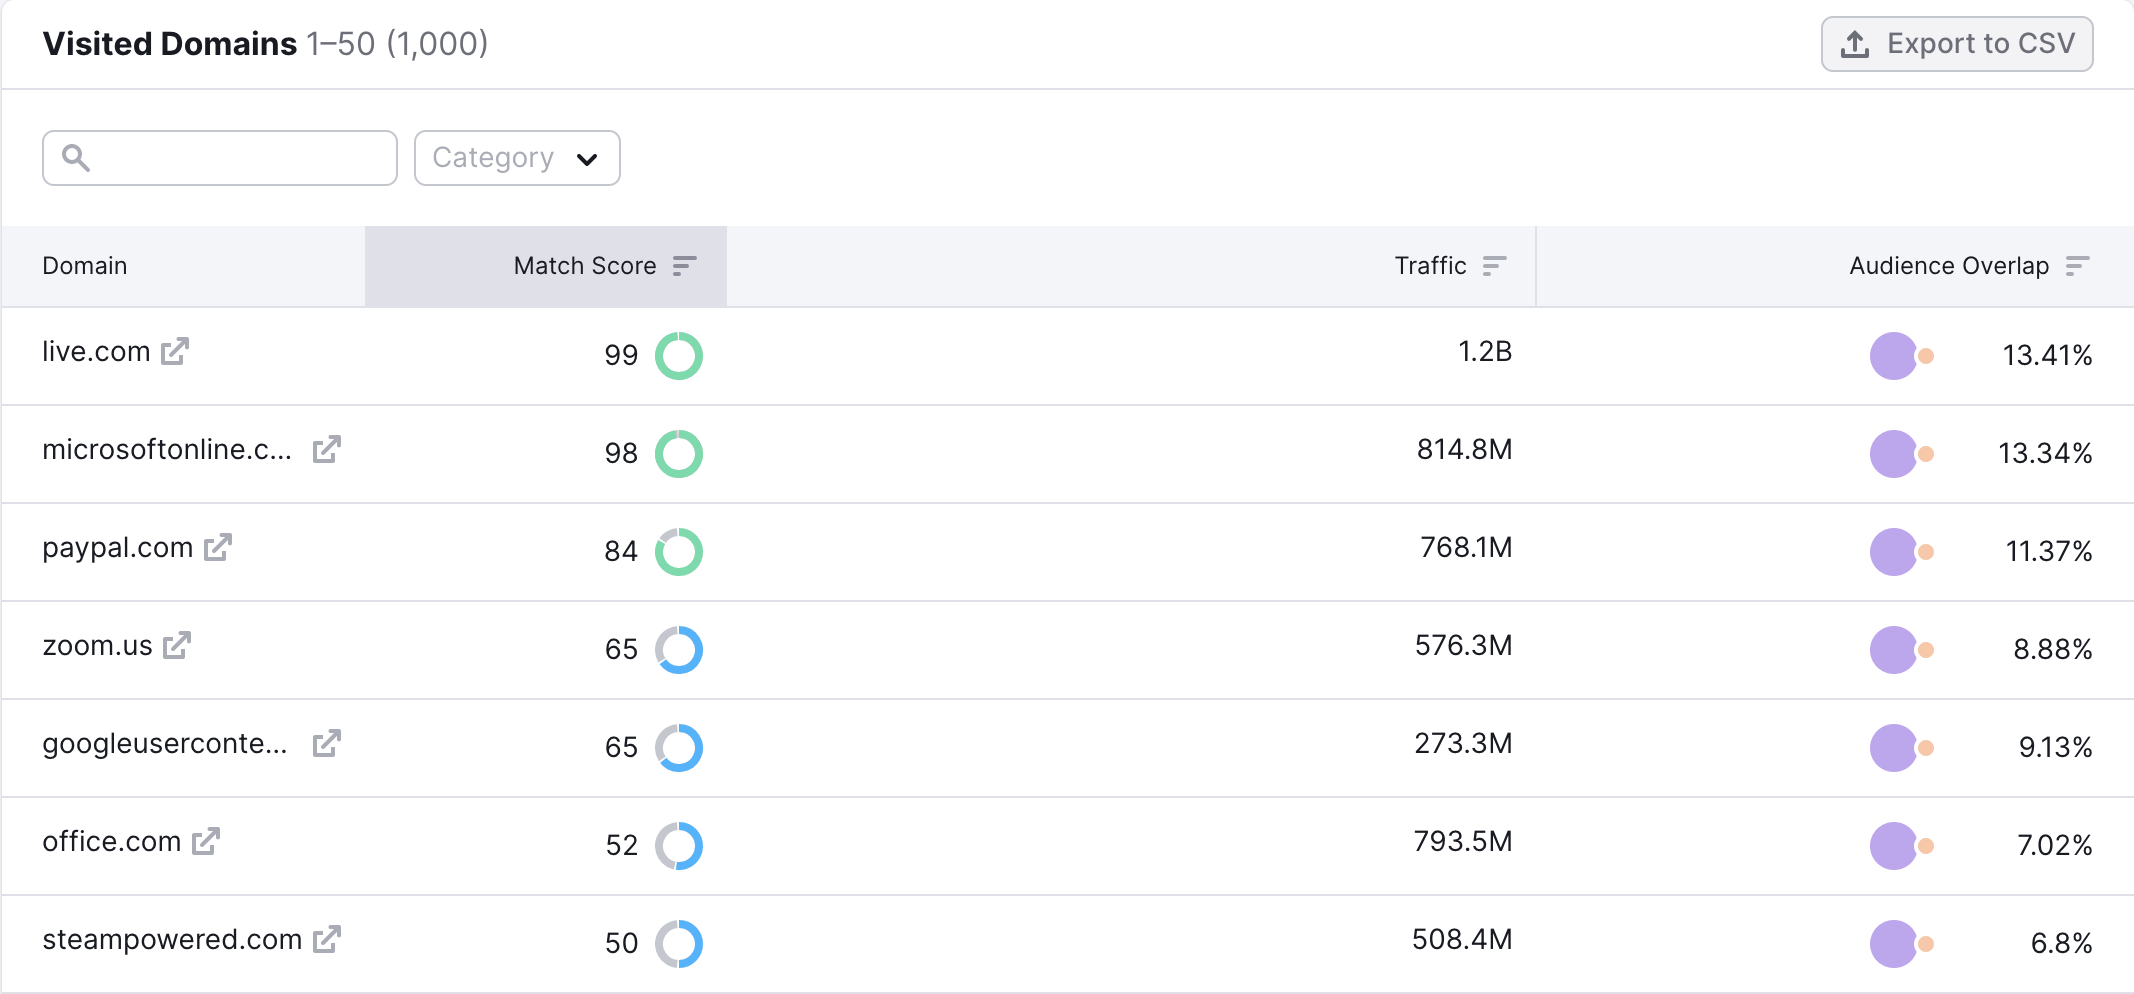
If you scroll down to the area on the report that says Traffic Channels, you can identify which channels are bringing the most traffic to websites in the niche and which channels are less relevant. Traffic schannels include direct, referral, organic search, paid search, organic social, paid social, email, and display advertising.
In the image below, we can see that social networks, paid traffic, and referral traffic contribute the least amount of traffic to the sites in the report. Direct, and search traffic are much more prevalent.
Geographic Distribution
With the Traffic By Countries section you’ll be able to note any geographic trends in the niche. This could let you know about which regions are most interested in the niche.
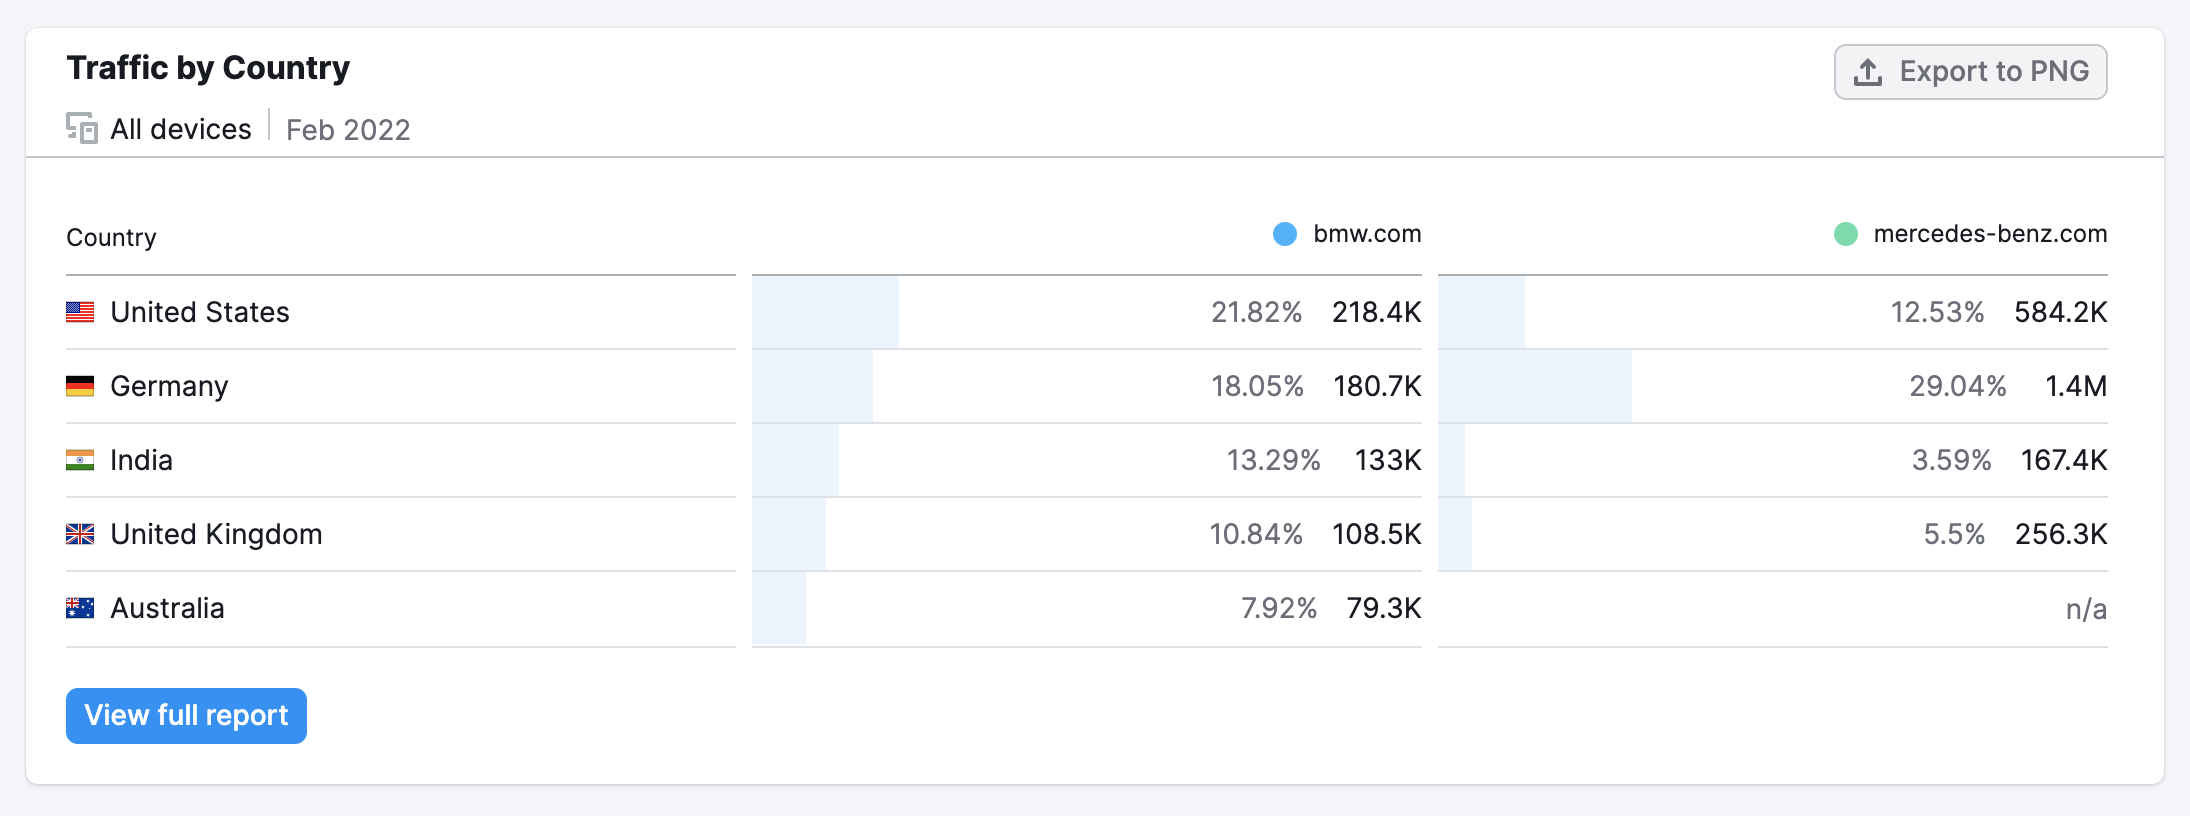
Benchmarking the top players in a niche against each other is a great way to study the best traffic acquisition strategies for this audience.
Next Steps — Studying Traffic
Ok, so you’ve evaluated the niche and have an understanding of what works best in this market. What next?
Once you identify the channels that work best, you can do more in-depth research into each channel using Semrush’s research tools.
Studying Referral Traffic
For example, a niche with lots referral traffic would be a good reason to research the Backlinks of the top sites. Use Backlinks Analytics or Backlink Gap to see what other websites are sending out links in the niche. You could also use the Media Monitoring tool or the Brand Monitoring app from the App Center to see how frequently the Internet mentions your competitor’s brand name.
Studying Organic Traffic
A niche with high search traffic would mean you should investigate the organic search positioning of these top sites. You can use our Organic Research reports and Keyword Gap tool to identify the keywords that each site ranks for and identify any gaps.
Studying Social Traffic
A niche with high social traffic means you should look closer at their social strategies by using the Social Tracker. The tool will let you track up to 300 domains (depending on your subscription plan) across the major social networks. You could also use the Topic Research tool to look at what topics are getting the most attention and social shares in your niche.
Studying Paid Traffic
Lastly, a niche with lots of paid traffic means you should uncover your competitor’s advertising strategies using our Advertising Research reports. The Ad History report will show you all of the ads and keywords Semrush found a domain ranking for over the past 12 months. Lastly, if your competitor sells products online, you can investigate their Google Shopping campaigns with our PLA Research reports. This will give you an inside look at their strategy. Lastly, if you're looking to explore competitive Display Advertising creatives turn to the AdClarity App in the Semrush App Center.