Market Explorer’s custom Market List gives you all of the functionality of the tool but goes one step further by allowing you to set the list of domains you’re comparing.
With custom Market Lists you are able to:
- Research when launching a new product or entering new territories.
- Analyze your market position and identify growth areas.
- Be aware of dangerous competitors quickly gaining momentum.
- Identify successful competitor practices.
- Save your list of custom markets (up to 100 companies in a list)
Getting Started
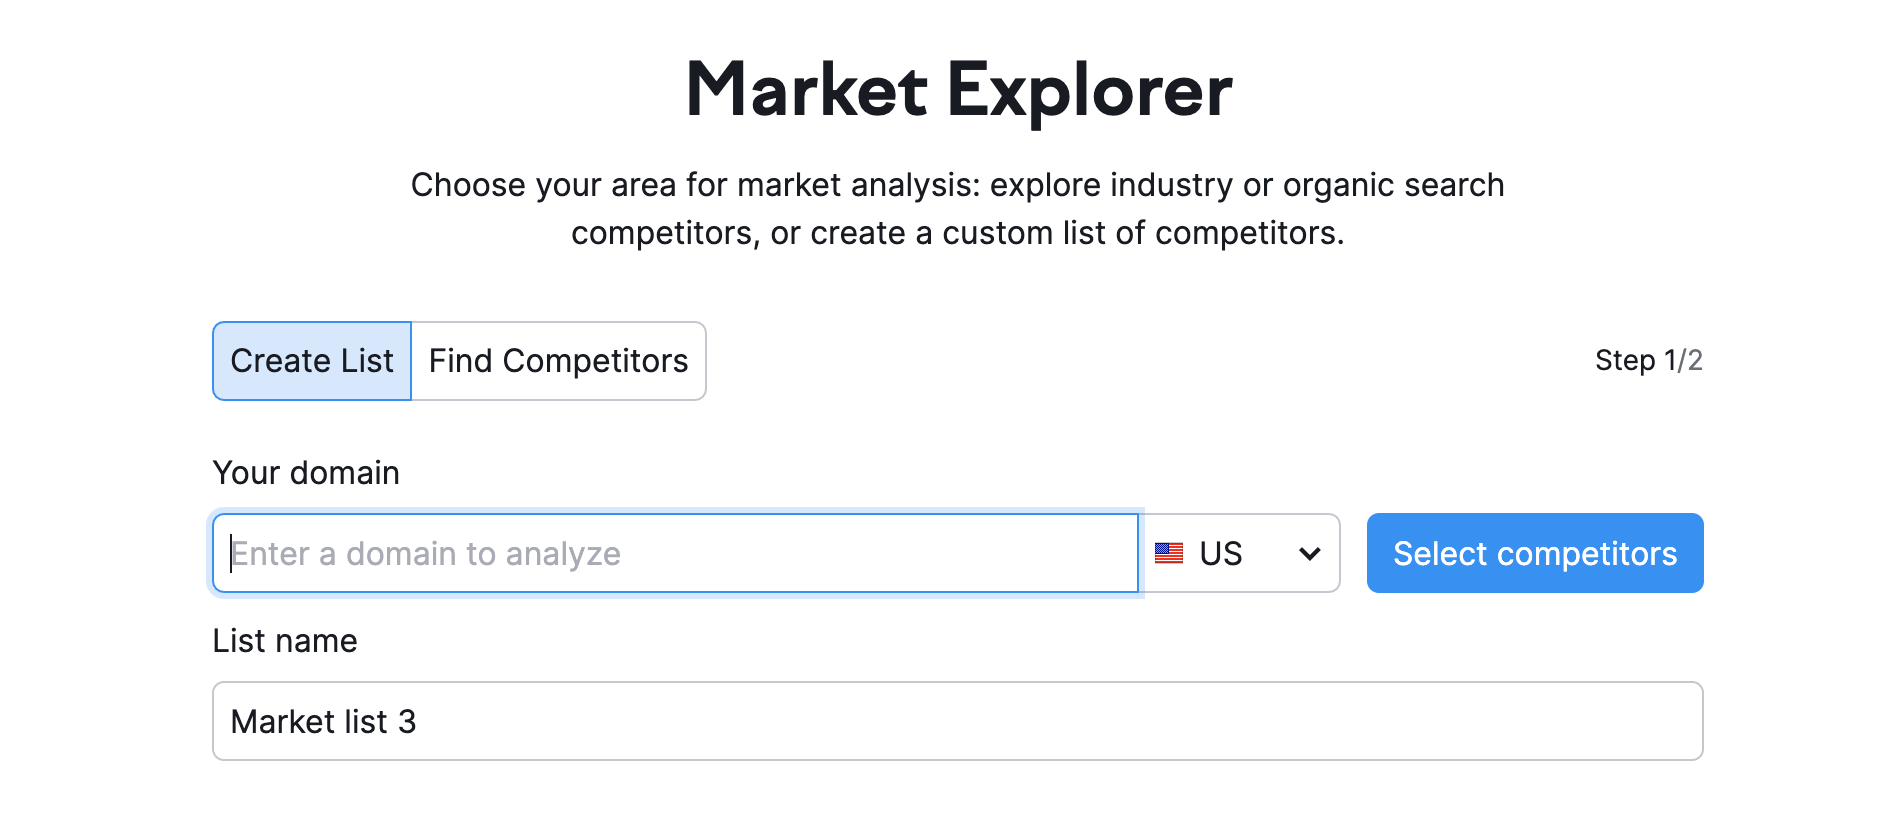
In Market Explorer, you can work with three types of reports:
- Create List: Manually select and report on up to 100 competitors in a Market list
- Find Competitors: Automatically report on competitors surrounding one domain; competitors' suggestion is based on organic search results.
- Analyze Category: Analyze up to 1,000 domains across an entire industry
Market Lists can be saved and viewed again later, so this option can be useful if you want to examine specific market segments. You can also import them to other .Trends tools. The Find Competitors option allows you to gain a better understanding of where you’re positioned within the niche.
How does Market list work?
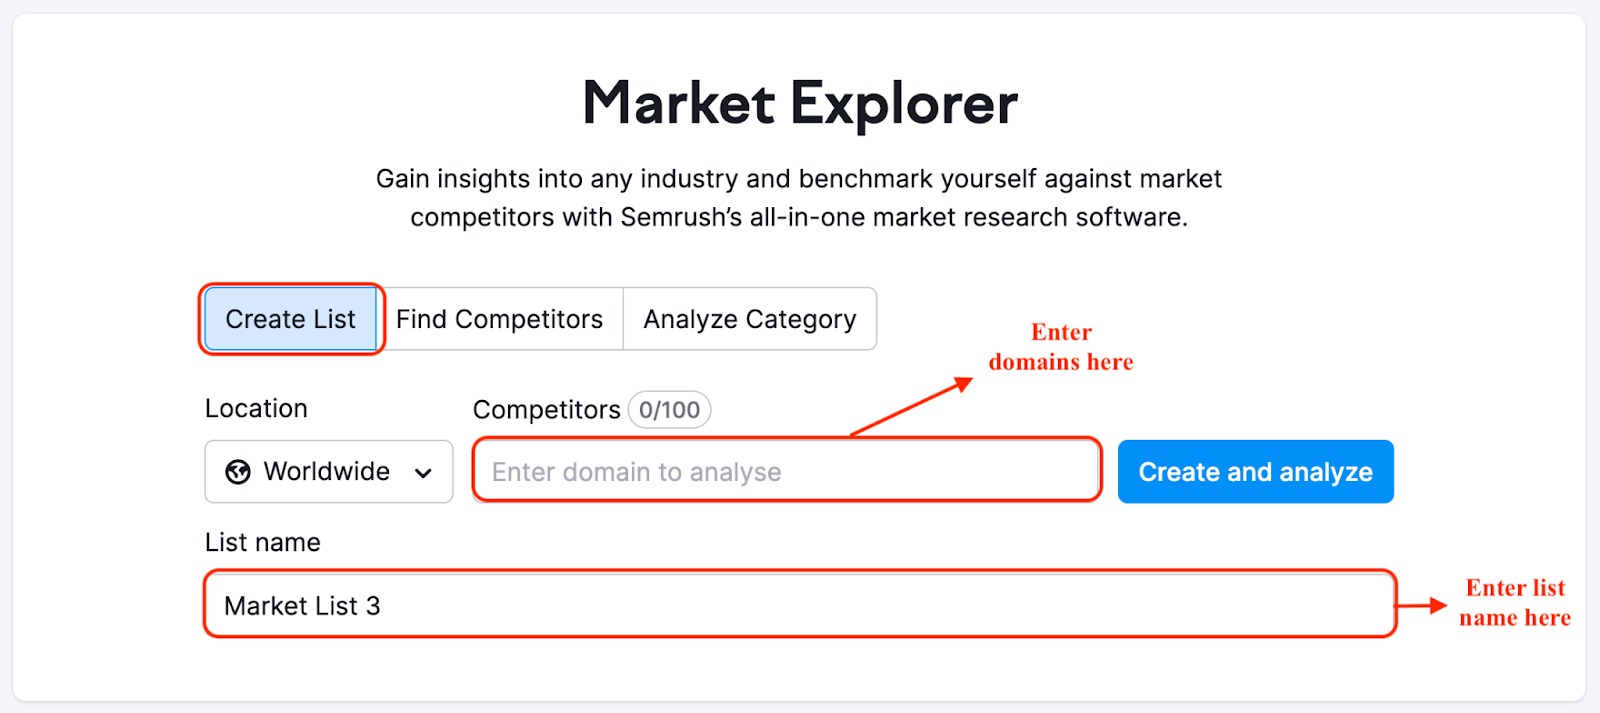
Enter your list of domains on the main page of the tool by clicking the Create list button. You can save this list of domains for future reference when you click the button Create and analyze. If you have lists saved, you will see all of them just below the search bar under All lists.
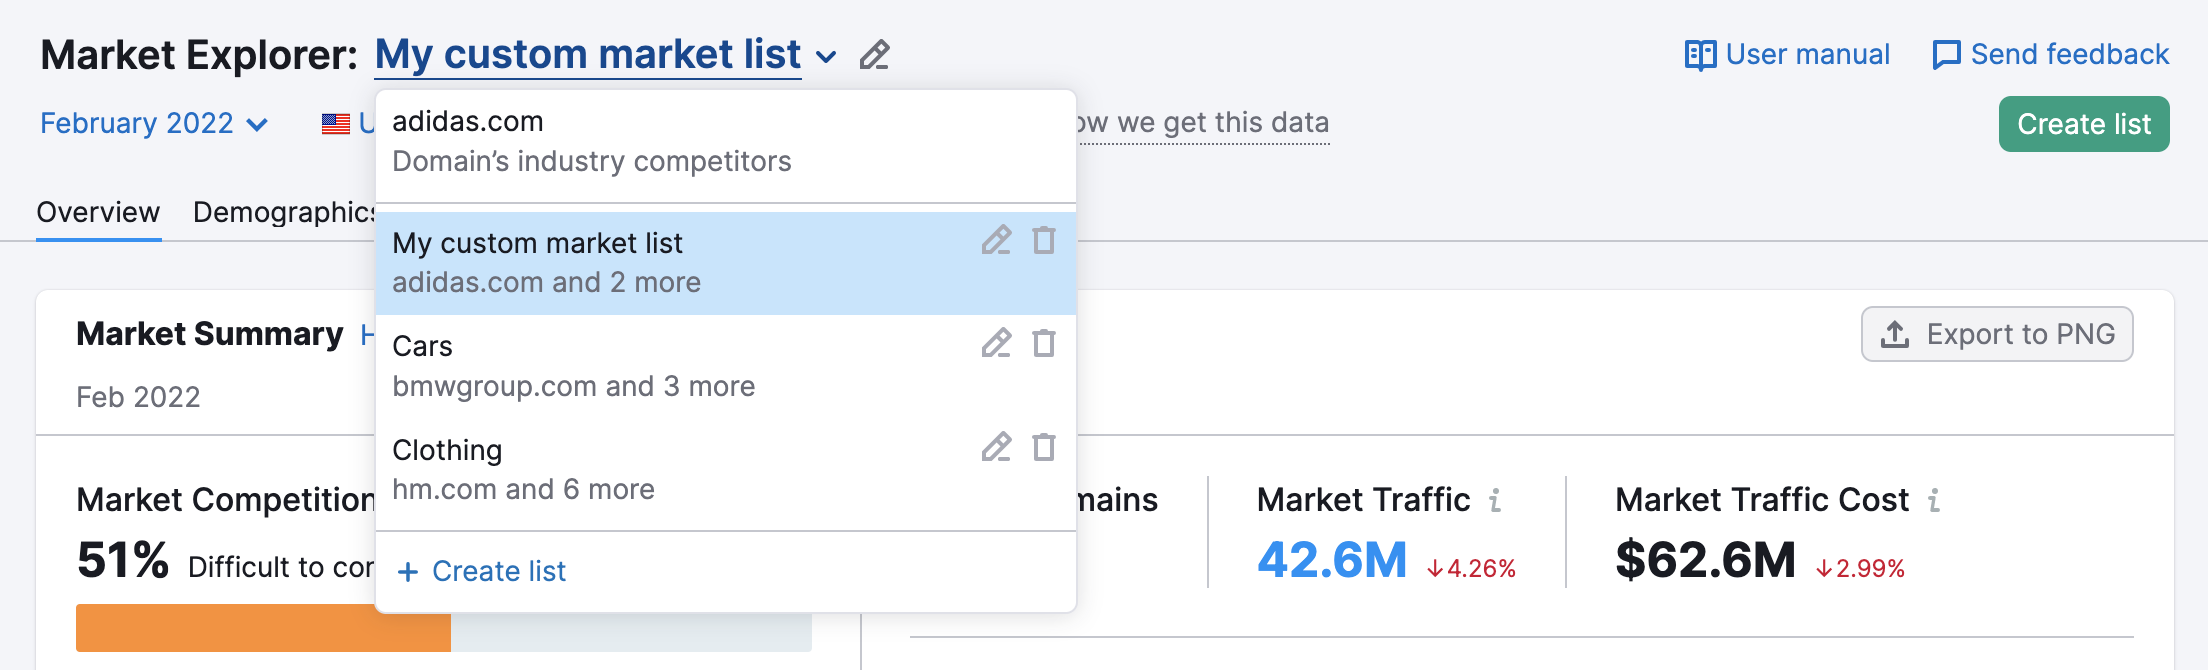
You can toggle between your industry competitors report [for your selected domain] and your saved Market Lists:
What can you discover using the Market Lists?
1. Competitive Landscape
With Semrush Market's Growth Quadrant on the Overview report, you not only get the competitive landscape for top industry players, but you also get answers to your questions regarding a custom list of competitors:
- Who actively grows and becomes a Leader or a Game Changer.
- What small companies or new competitors are considered the Niche Players
- Who is the Established Player in the market, i.e. has long been in the market, and has a huge amount of total traffic that is growing slowly?
If your product or brand is already present in the market, then you can include it in the list of analyzed domains. This will allow you to compare your growth and your tactics with your competitors, uncover gaps, strengths, and weaknesses, and optimize your marketing and business development strategy.
We recommend you return to the report at least once a month in order to see the important changes over time.
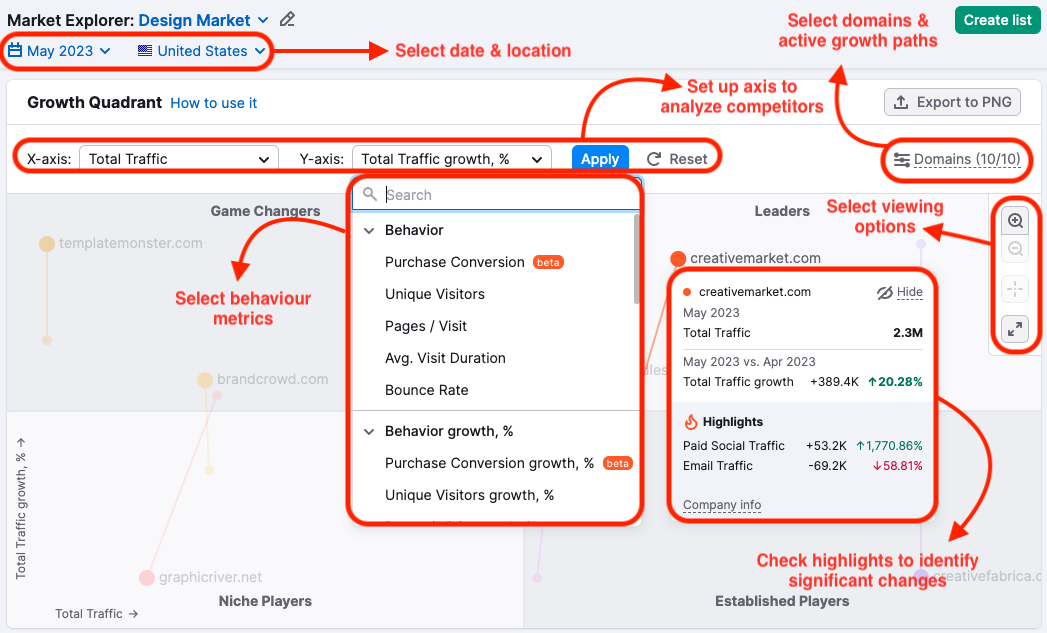
With the Growth Quadrant, you can view up to 100 competitors in a single matrix. Use the full-screen option for a wider view or zoom in and out using the icons in the upper right-hand corner of the matrix, enable growth paths, add and remove competitors from the quadrant, and setup axes to analyse competitors from different perspectives.
2. Market Audience
The Audience report analyzes the audience in your industry, providing you with actionable insights into who you (and your competitors!) are marketing to, and how they behave online. Here you will see the ratio of men and women of different ages that visited the entered websites. You can also analyze the audience's social media preferences and interests.
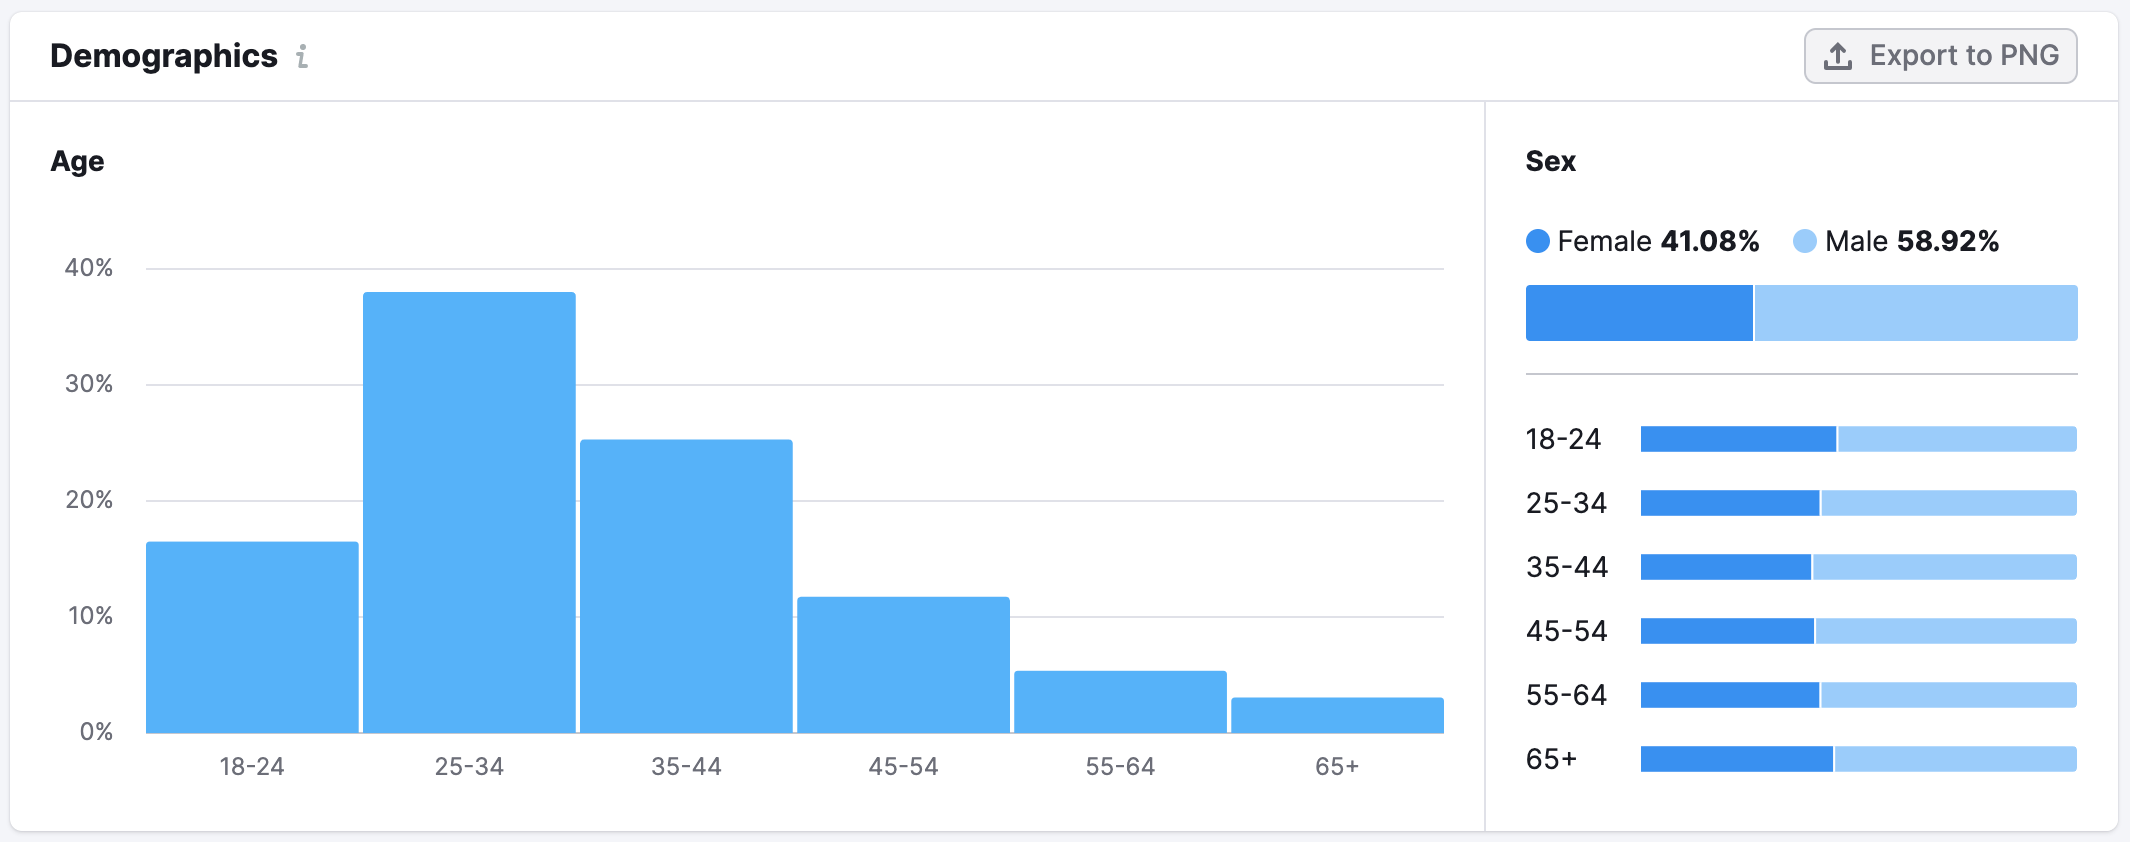
Using this data, you can target your marketing strategy to the right age groups with specific interests.
GEO Distribution
On the Overview tab of the report, you can see the global GEO Distribution of your custom market list. This tells you the percentage breakdown of the top countries that contribute traffic to these sites. Next to the country percentage, you can see the total traffic gain from that country for the entire custom market, as well as the percentage of change in the analyzed month (green for positive, red for negative).
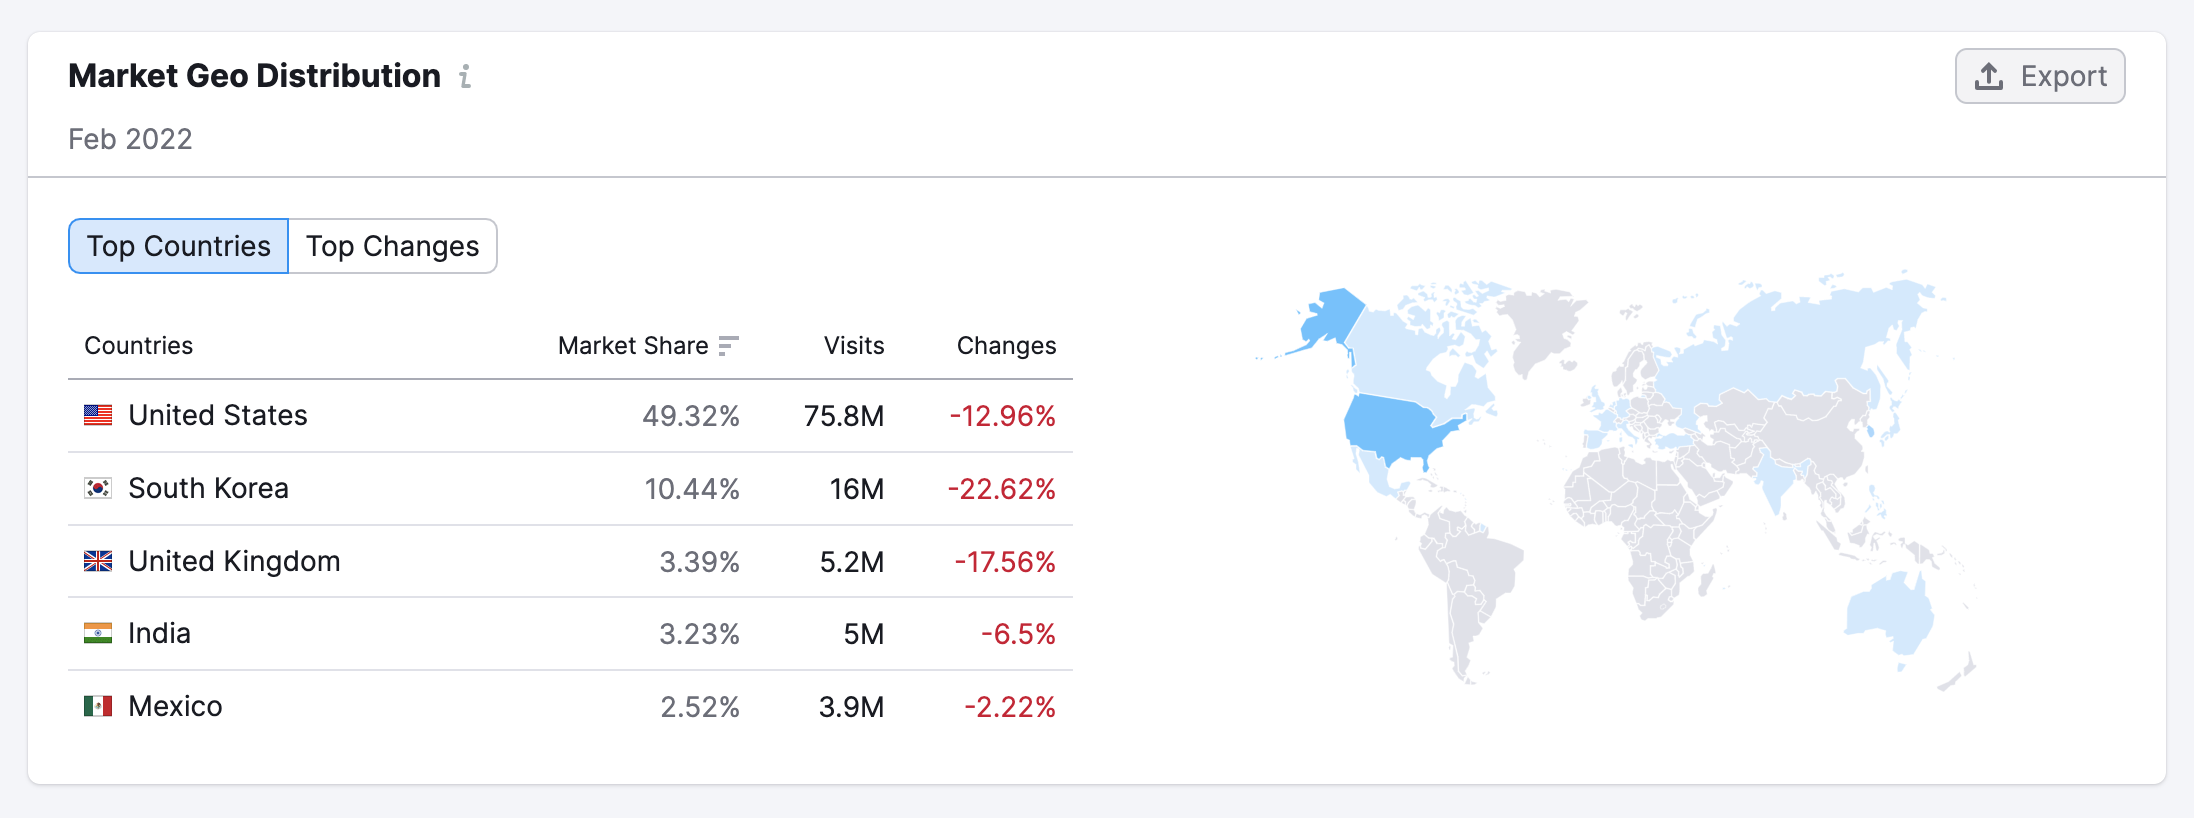
If you want to see the Growth Quadrant & Custom Market Dynamics for a specific country, you can change the region at the top of the report and these widgets will update with region-specific data.
However, please note that the Market Audience and GEO Distribution always represent the custom market’s global audience.
3. Gaps and Opportunities
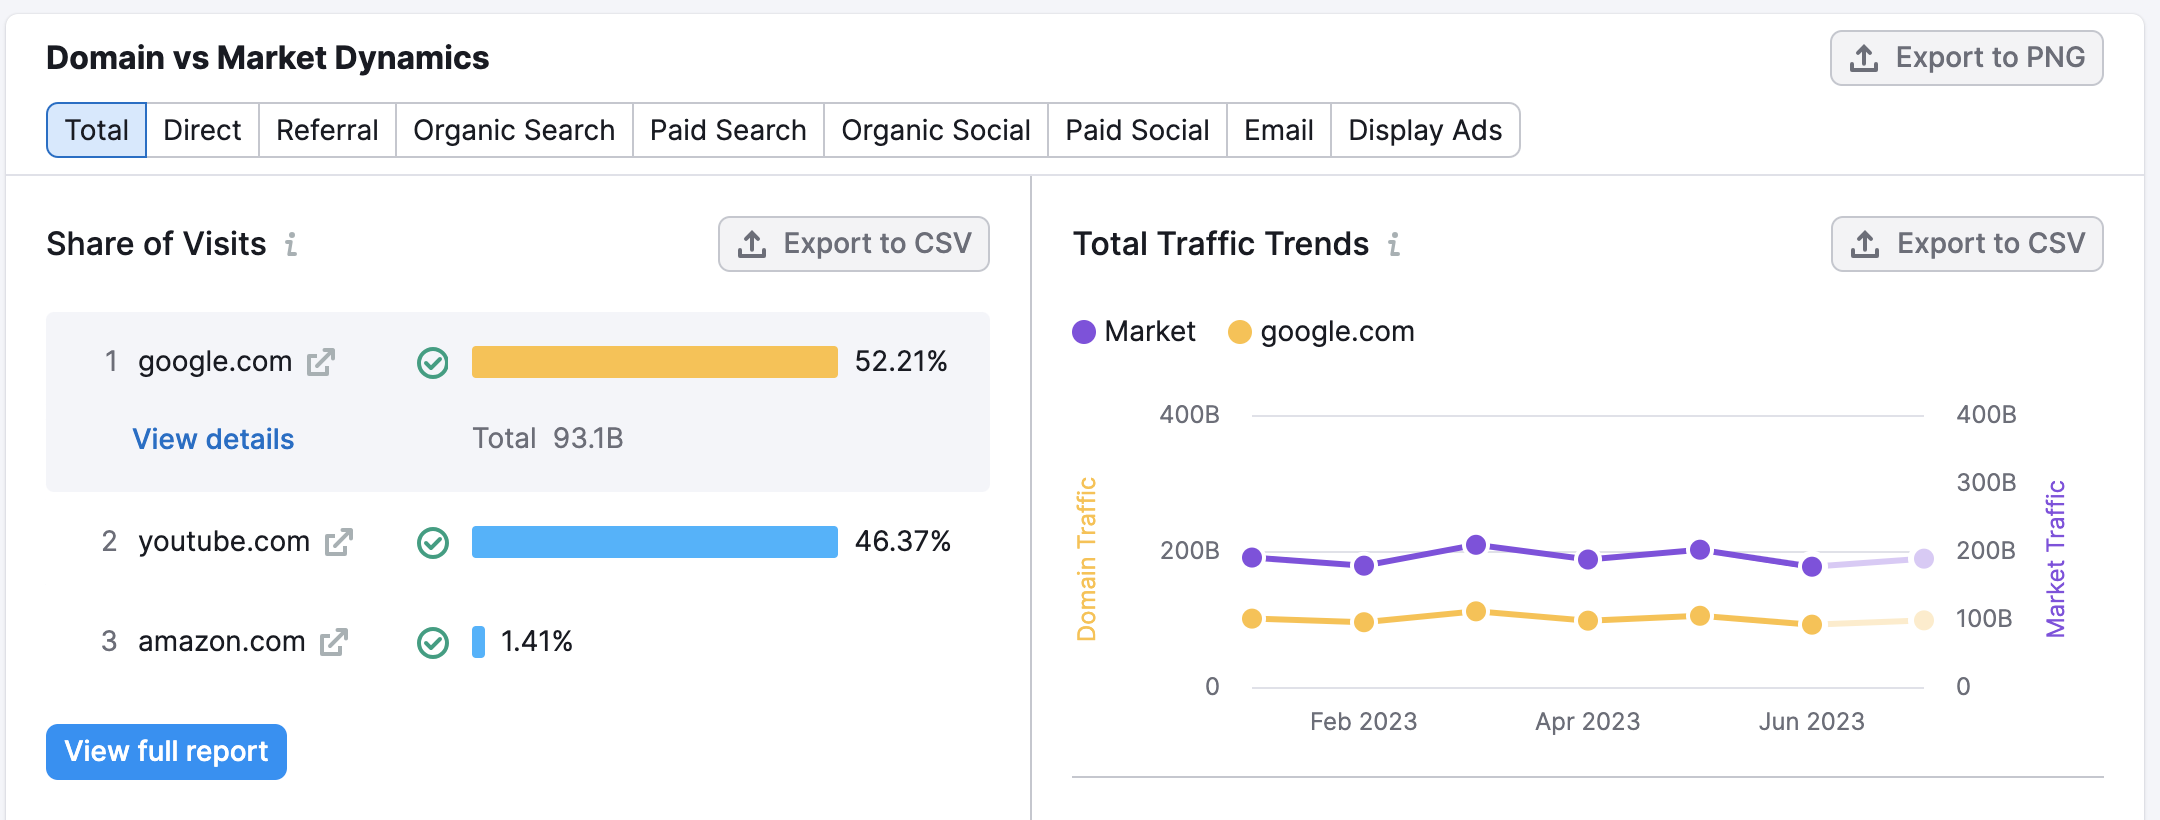
In the Market Dynamics section of the Overview report, you can analyze the marketing strategies of the market list players. This will help you benefit from the successful tactics of the market’s Leaders and quickly learn from the rapid growth of the market’s Game Changers.
Domain vs Market Dynamics
Suggested workflow:
- Select up to 5 domains at the same time (you can later change them).
- The widget will present its Total, Direct, Referral, Organic Search, Paid Search, Organic Social, Paid Social, Email, and Display Ads traffic trends.
- Find insights about your competitors' strategies
- Сompare the companies’ trends with the Market Traffic trend.
For example, you can pay attention to cases such as:
- The entire market goes down in total or any specific source of traffic, while one of the companies is growing. You should definitely do a deep analysis of that company’s current strategy.
- There are companies that increase sharply during a seasonal change. Do they launch specific marketing campaigns or what is their secret? Identify these companies and then figure out exactly what they do using Traffic Analytics, Organic Research, Advertising Research and Social Tracker.
Traffic Generation Strategy
The widget represents a breakdown of traffic by acquisition channels.
Suggested workflow:
- Take a look at the Market line — with its help, you can determine through which channels all the analyzed companies attract traffic on average.
- Compare the traffic mix between companies and analyze the gaps.
- Think about the perspective to build on these gaps.
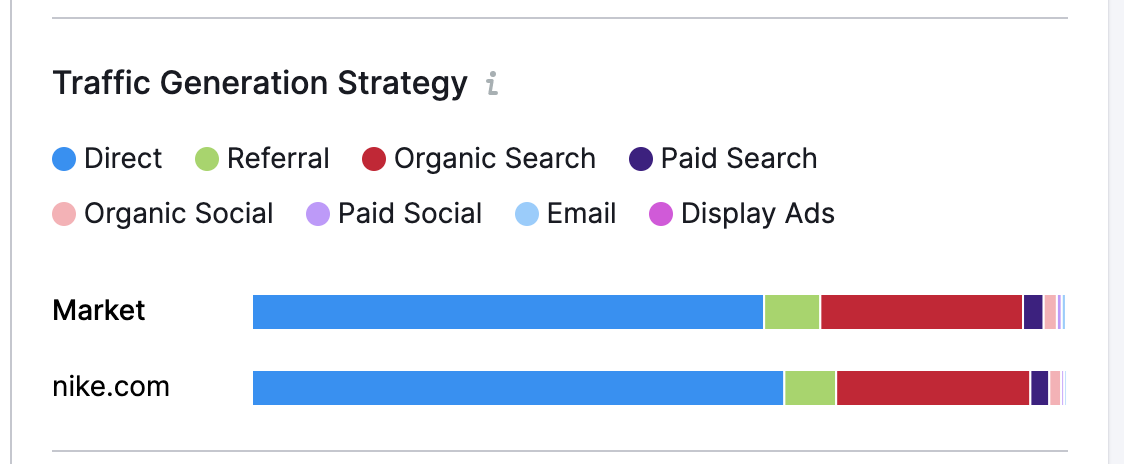
Take a look at the referral traffic of nike.com. The amount of referral traffic that the website receives is very similar to the average market value.
You can go even deeper and analyze which of the competitors is best in getting referral traffic, and then dive into the Traffic Analytics tool to understand who their best referral partners are.
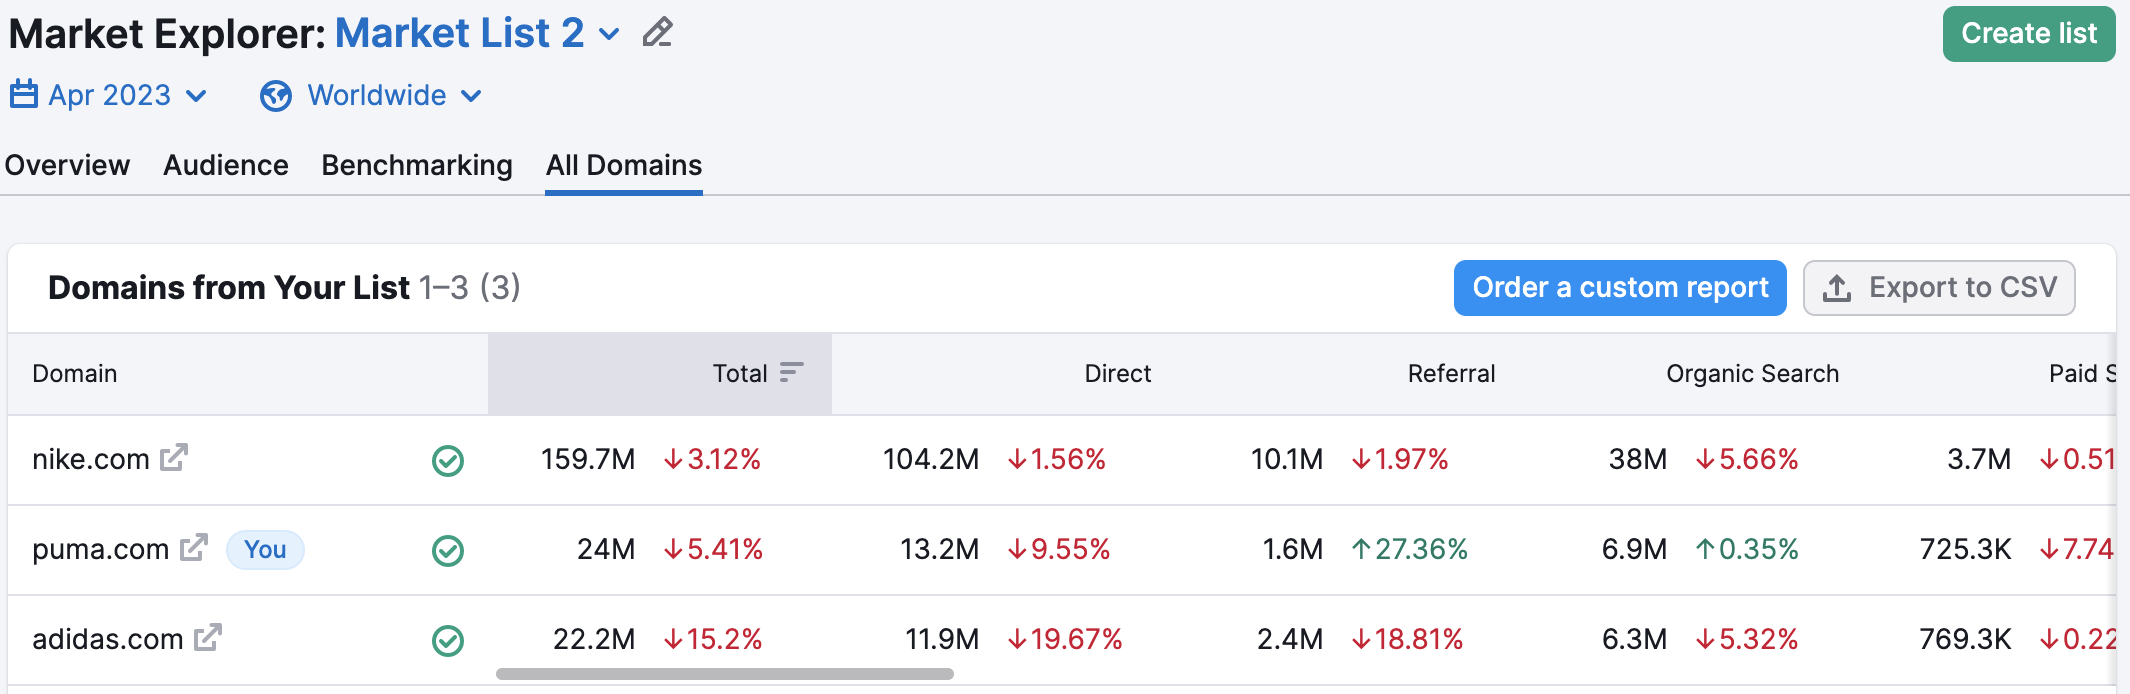
All Domains
The All Domains report makes it easy to find and compare market leaders. The Domains from Your List table ranks competitors by Total traffic share.
To look at this data simply switch to the All Domains tab. Here you can see the traffic of your market list broken down by:
- Total Traffic
- Direct Traffic
- Referral Traffic
- Organic Search Traffic
- Paid Search Traffic
- Organic Social Traffic
- Paid Social Traffic
- Email Traffic
- Display Ads Traffic
- Purchase Conversion (%)
- Unique Visitors
- Pages/Visit
- Average Visit Duration
- Bounce Rate (%)
- Share of Visits (%)