Offered exclusively to .Trends users, the All Domains report allows you to analyze your competitors’ monthly traffic and share of visits across all acquisition channels.
How Can the All Domains Report Help Me?
With the All Domains Report, you can analyze the traffic and website performance generated by your industry competitors or a custom market list month over month. With this data, you can:
- Identify and analyze industry trends
- Benchmark your traffic performance versus the competition
- Analyze your competitors’ acquisition strategies by pinpointing their strongest and weakest acquisition channels
- Analyze how the audience interacts with your competitors’ domains
Using the All Domains Report
The All Domains report breaks down traffic by acquisition channel for each competitor domain analyzed in your industry or custom market list and provides their main behavioral metrics.
Acquisition channels include:
- Total
- Direct
- Referral
- Organic Search
- Paid Search
- Organic Social
- Paid Social
- Display ads
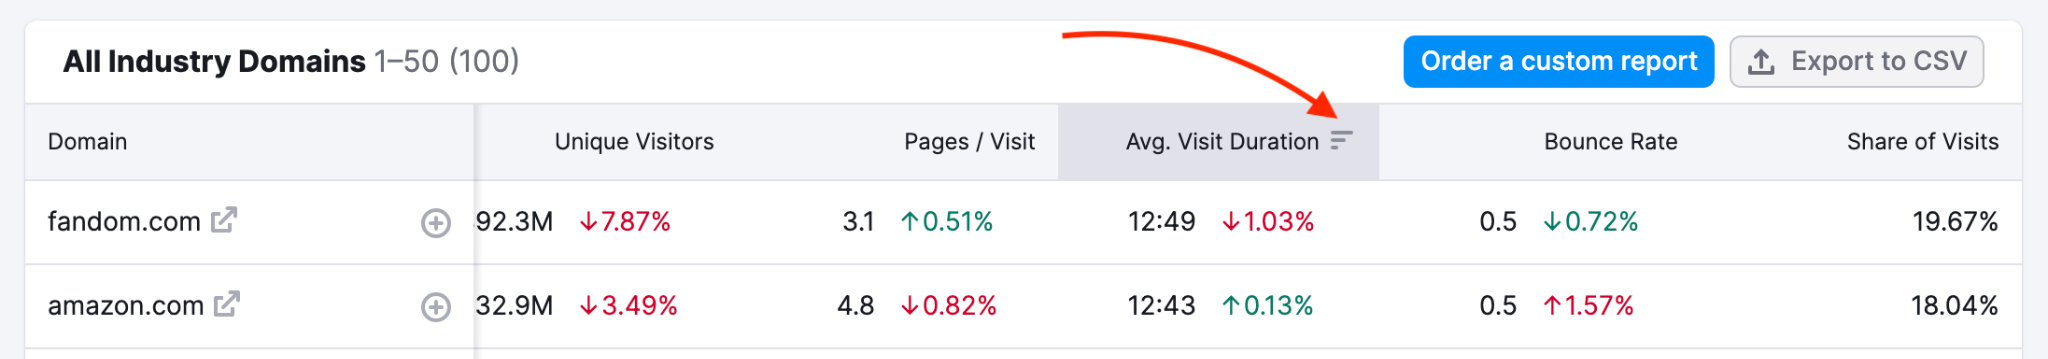
Behavioral metrics are:
- Unique visitors
- Pages/Visit
- Avg. Visit Duration
- Bounce Rate
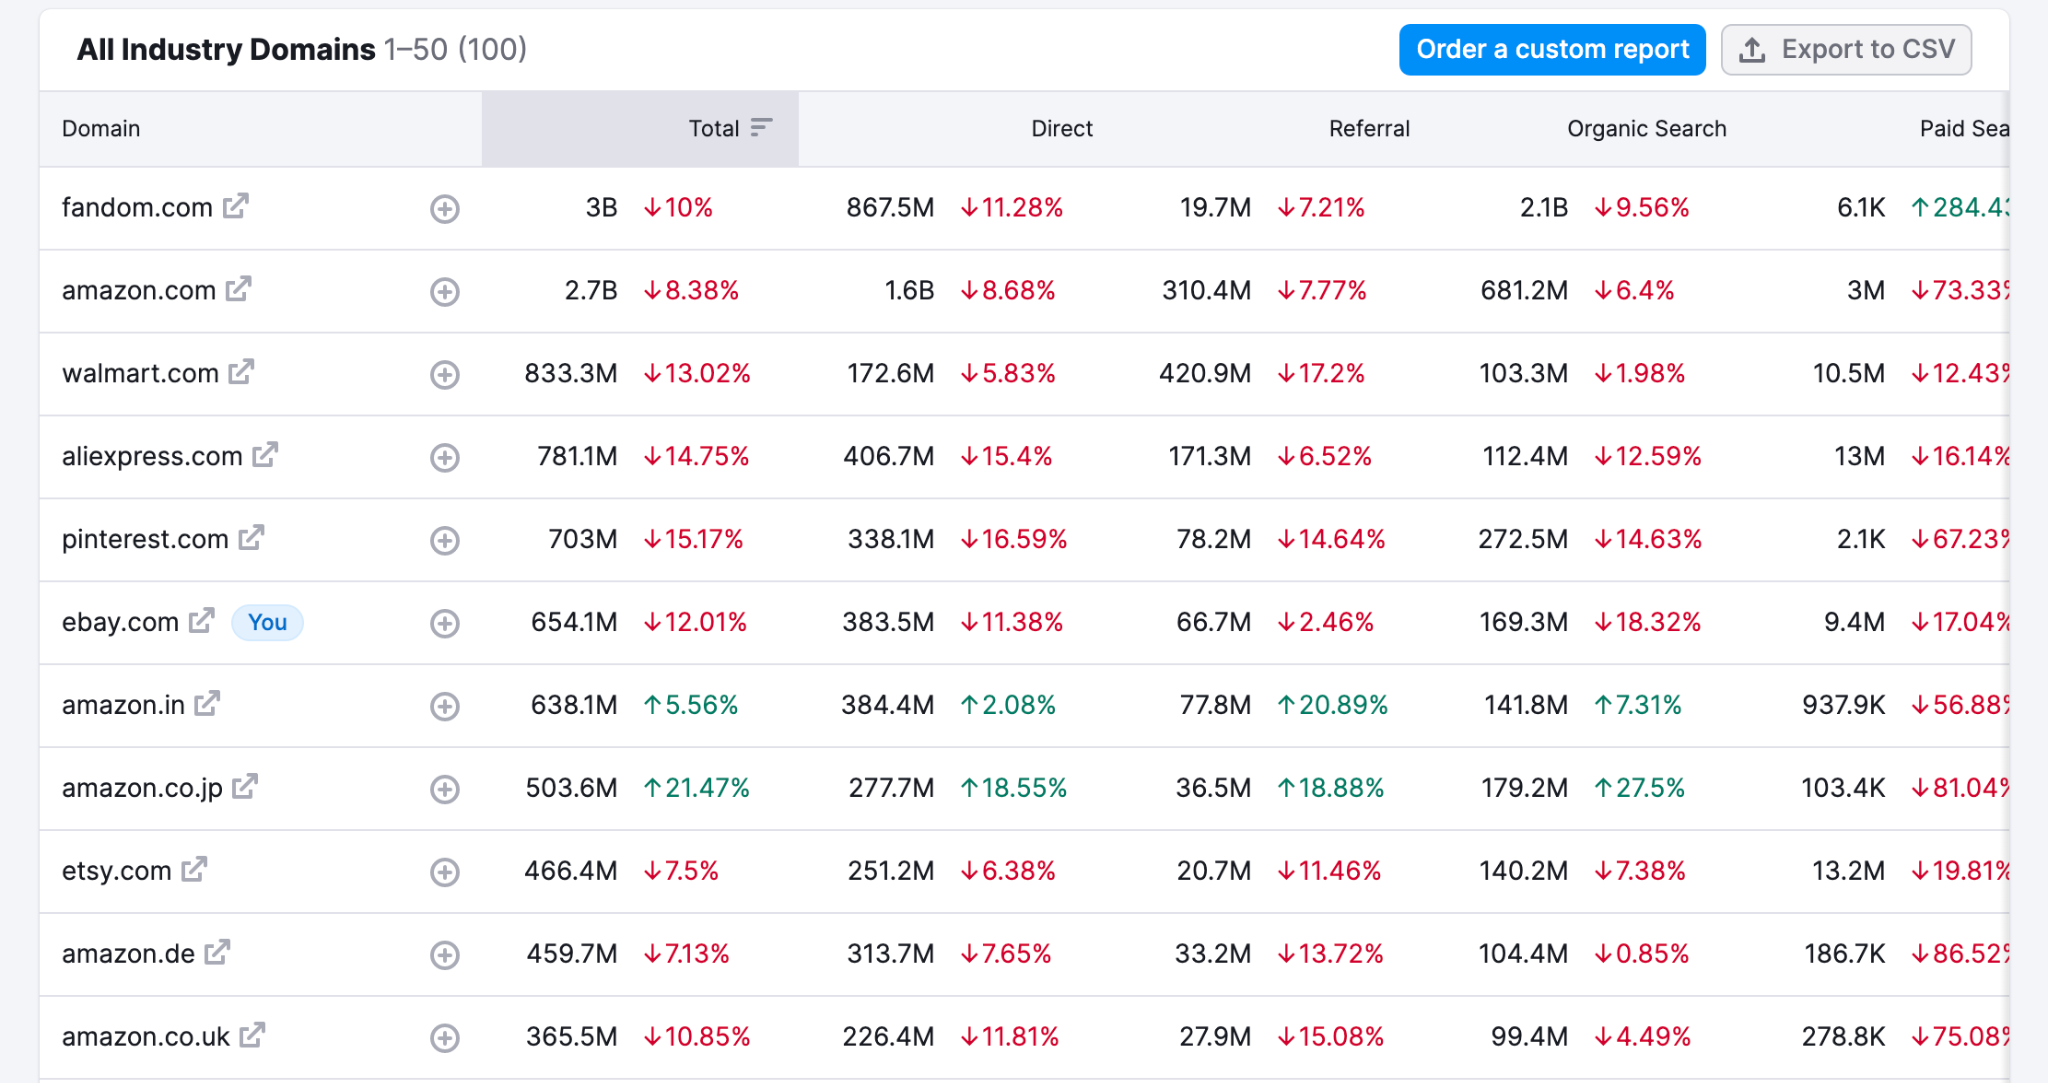
Each column contains a metric number (for example, the total amount of traffic generated in the referral channel) calculated for the month you selected. Here, you’ll also find a red or green percentage, which indicates the change compared to the previous month. Here, red indicates a loss, and green indicates a gain. If there is no percentage, that means the number is flat to the previous month.
Note: the Share of Visits figure is calculated based on the total number of visits generated by each analyzed domain. If you update the list, these figures will also update accordingly.
By default, this chart is sorted by Total Traffic. However, you can re-sort by domain name, acquisition channel traffic, or any other metric by clicking on the appropriate column header:
Please note that there’s a limit to view and export up to 500 lines. If you’d like to see or export more lines, please feel free to order a custom report by clicking the “Order a custom report” button on the right.
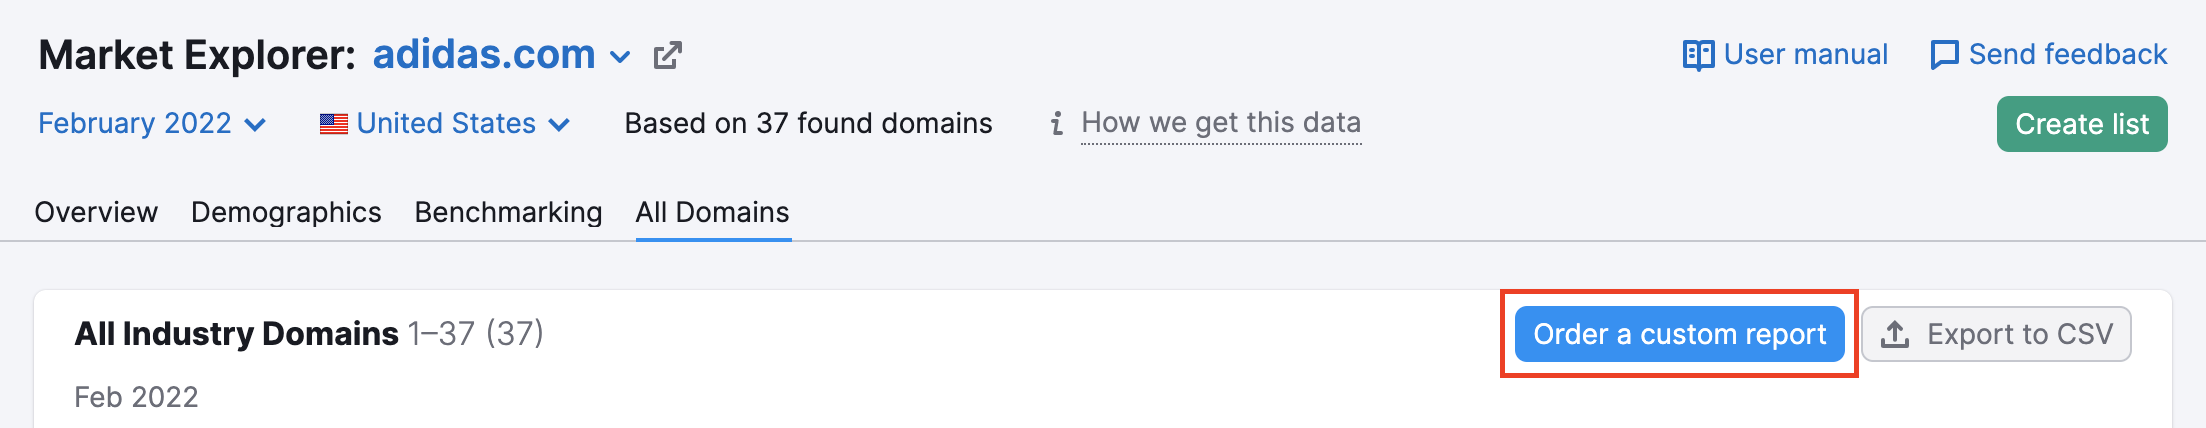
A window will pop up in the center of your screen, where you can provide your name, contact information, and some details about your request.
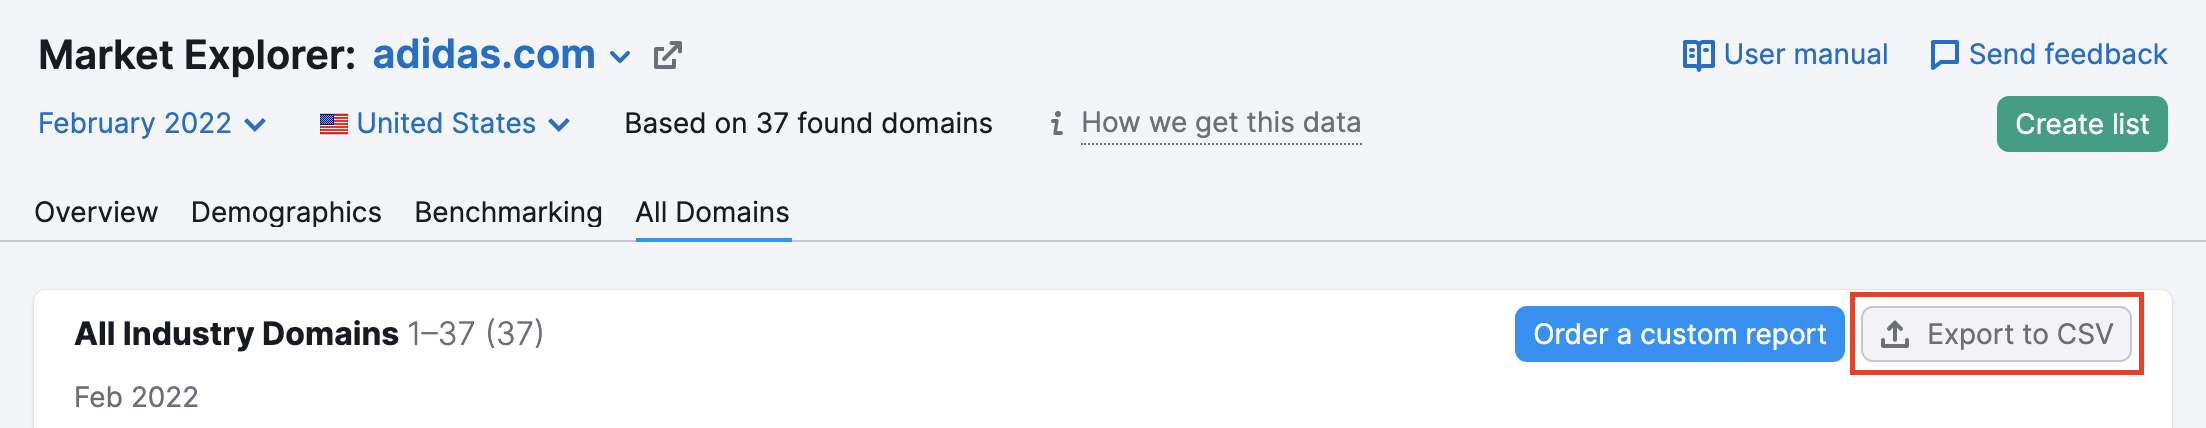
If you need to export your All Domains report for use elsewhere, click the “Export to CSV” button on the right.